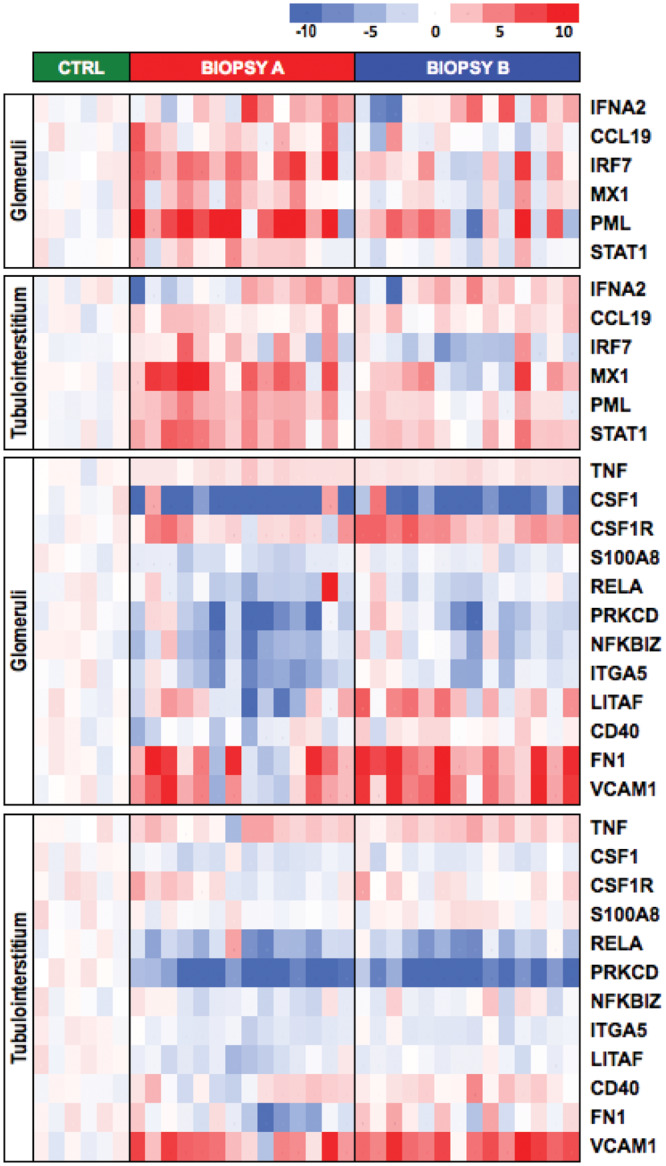
FIGURE 2.

IFNα- and TNFα-regulated genes differentially expressed between biopsy A or B and normal controls. Genes are listed in the heatmap using z-score of normalized gene expression level. Each column is an individual patient or healthy control. Column 1 in biopsy A and column 1 in biopsy B correspond to the same patient.
