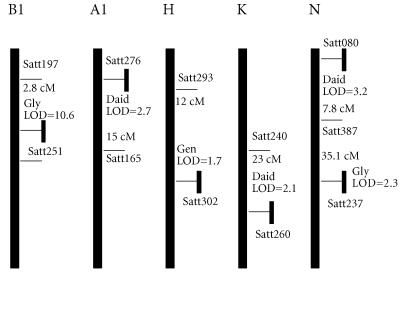
Figure 3.
Location of microsatellite markers and QTL that condition phytoestrogen content. END indicates the likely position of the telomere on that linkage group, the disjunct bar represents the rest of the linkage group. Marker names and distances and peak LOD score for the interval are given. LOD scores are from single locus analyses of additive gene effects using Mapmaker/QTL 1.1. Genetic distances were from the recombinant inbred line function of Mapmaker/EXP 3.0.

