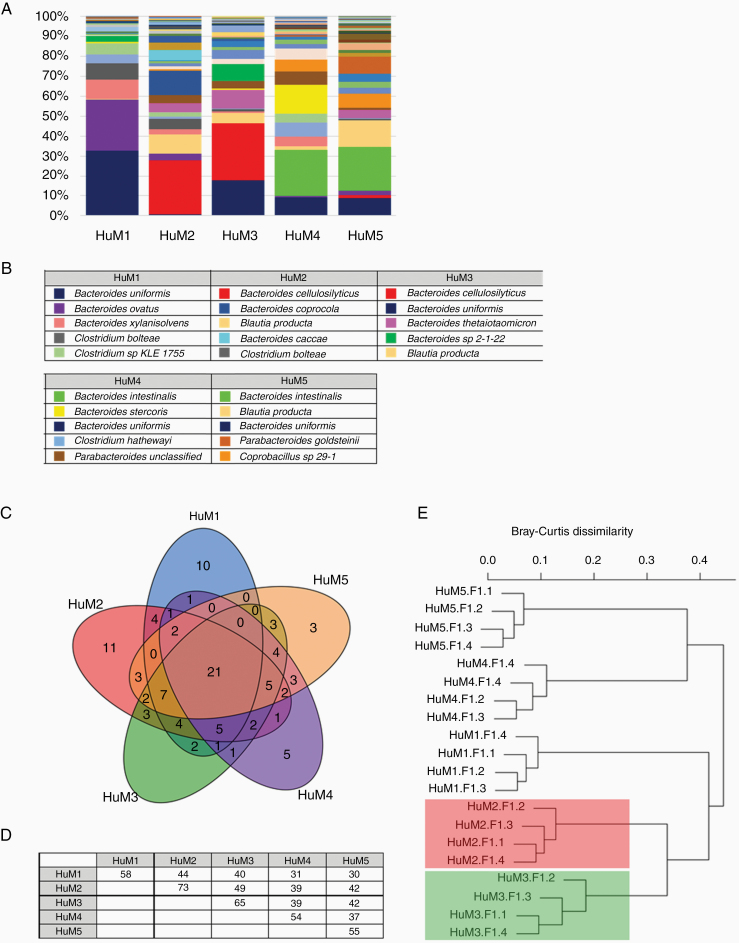
Figure 4.
Taxonomic distribution of microbial communities in the HuM mice. (A) The relative abundance of 111 observed species across all HuM mice are shown. Averages for each HuM strain are shown (n = 4 mice per group). (B) The top 5 species are listed for each of the HuM mice. (C) A Venn diagram representing shared and unique microbial species among the 5 HuM groups. (D) Pairwise comparison matrix for the 5 HuM groups. Additional shared microbes between 2 or more HuM groups are shown in Supplementary Table 3. (E) Bray-Curtis dendrogram analysis represents significant and distinct clusters specific to each group. HuM2 and HuM3 cluster groups are highlighted in red and green, respectively.

