
FIGURE 6.
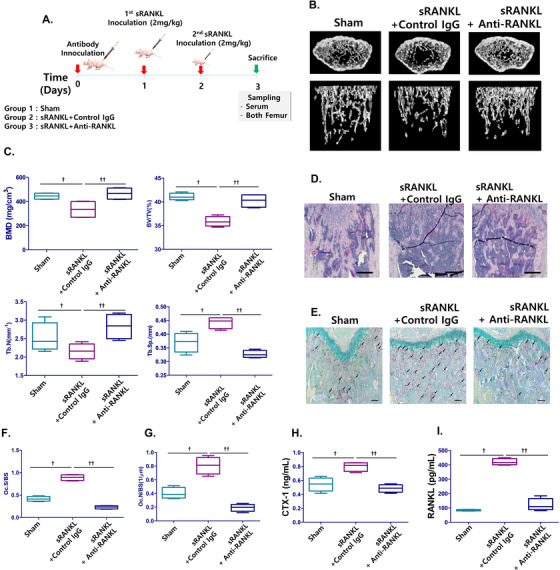
Effect of anti‐RANKL IgG induced by RANKL variants on sRANKL‐induced mice femurs. A, Immunization and sampling schedule in sRANKL‐induced mice. B, Three‐dimensional micro‐CT images revealed the trabecular bone architecture of the volume of interest in Sham‐, sRANKL with control IgG, and sRANKL with anti‐RANKL mice femurs (n = 10 images taken in total, one image for each mouse). C, Bone mineral density (BMD), bone volume/trabecular volume (BV/TV), trabecular number (Tb. N.), and trabecular separation (Tb. Sp.) are shown. D, Histomorphometric analysis. Magnification is 20×. The scale bar represents 500 μm. E, TRAP staining (n = 20 images taken in total, two images for each mousse) in the femurs. The arrow indicates TRAP positive cell. Magnification is 100×. The scale bar represents 50 μm. F, Parameters of femur osteoclasts. Oc.S/BS osteoclast surface per bone surface. G, Oc.N/BS, osteoclast number per bone surface. H, CTX‐1 and I, RANKL levels in mice sera. C, F, G, H, I, Error bars are mean ± SD. †P < .05 for Sham versus sRANKL + Control IgG group and ††P < .05 for sRANKL+Control IgG versus sRANKL+Anti‐RANKL