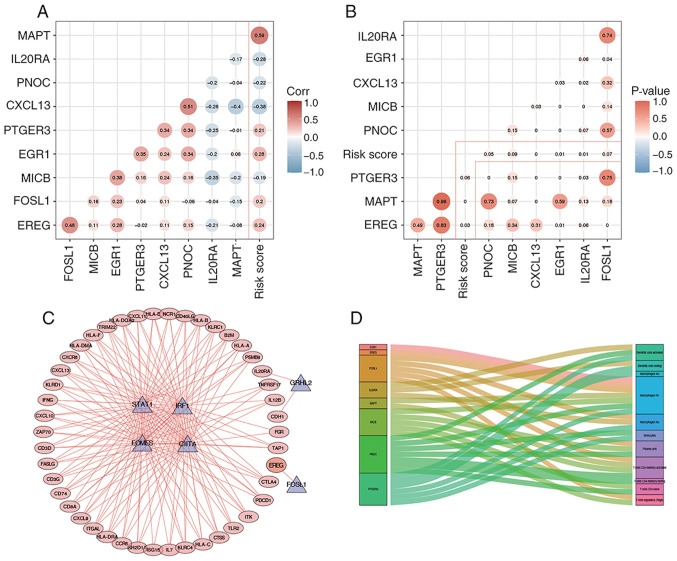
Figure 10.
Correlation analysis of the risk score and gene expression level of the prognostic model and establishing a gene regulatory network of the prognostic TFs and IRGs. (A and B) Correlation coefficients and P-values of among model genes and the risk score of the BLCA patients using Pearson's correlation method. (C) Gene regulation network of the prognostic TFs (the triangle nodes) and IRGs (flat ellipse nodes). (D) Correlations of immune cells infiltration and model genes were shown in the form of a Sankey map. IRG, immune-related gene; TF, transcription factor; MAPT, microtubule-associated protein tau; PNOC, prepronociceptin; PTGER3, prostaglandin E2 receptor EP3 subtype; EGR1, early growth response protein 1; MICB, major histocompatibility class I polypeptide-related sequence B; FOSL1, FOS-related antigen 1; EREG, proepiregulin.

