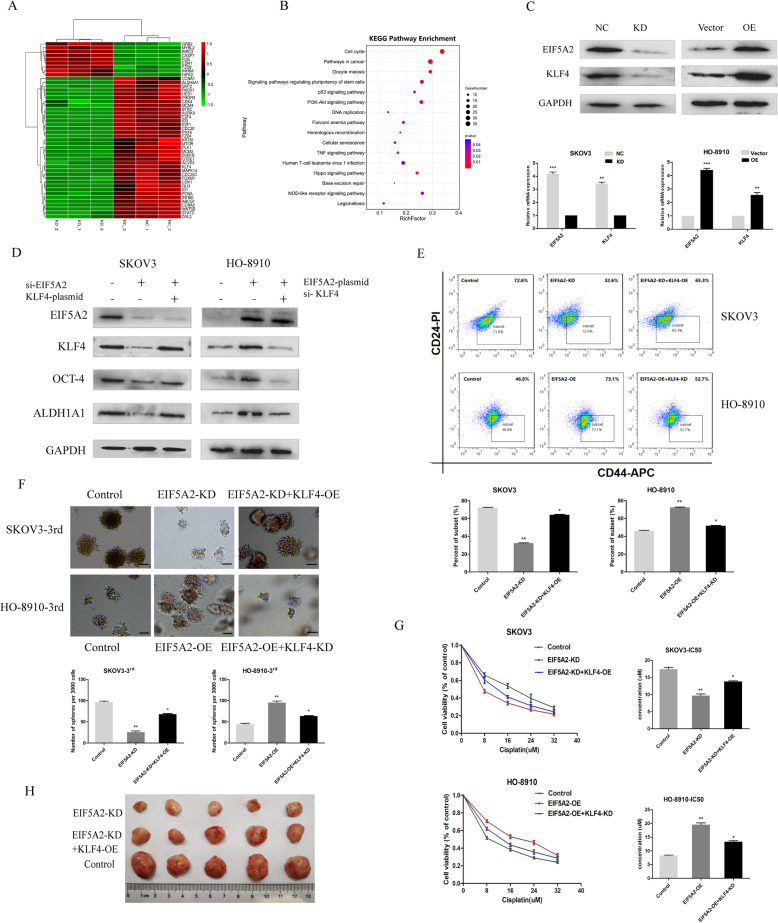
Fig. 4.
KLF4 participates in the EIF5A2-mediated modulation of CSC properties in EOC. a RNA-sequencing data from the analysis between NC and si-EIF5A2 SKOV3 cells. The cluster map generated by DESeq2 software analysis displayed a series of significant differentially expressed, top pathways enriched genes (fold change > 1.5) genes (Padj< 0.05). Downregulated genes are shown as green color and upregulated gene are shown as red color. b KEGG analysis of enriched pathways on the basis of transcriptome sequencing. c qRT-PCR and immunoblotting analysis of the expression of KLF4 in shNC, shEIF5A2 SKOV3 cells and vector, EIF5A2-plasmids HO-8910 cells. d SKOV3 cells were transfected with NC, si-EIF5A2 or si-EIF5A2 plus KLF4 overexpression plasmid, HO-8910 cells were transfected with a control vector, EIF5A2 overexpression plasmid, or EIF5A2 overexpression plasmid plus si-KLF4, and cultured in spheroid culture conditions for 7 days. The indicated stem-markers, OCT-4 and ALDH1A1, of SKOV3 and HO-8910 spheroids were detected by western blotting. e The proportion of CD44+/CD24− phenotype in SKOV3 and HO-8910 spheroids were detected by FCM (up: representative images, down: quantitative analysis). f Sphere-formation (sphere > 50 μm) was assessed (scale bars, 50 μm). g The sensitivity of cells to cisplatin was analyzed by CCK8, and the data are presented as the fold change relative to the treatment-free groups (left: cell viability curve, right: IC50 quantitative analysis). h The effect of EIF5A2 knockdown and EIF5A2 knockdown plus KLF4 overexpression on the growth of ovarian cancer cells in vivo was analyzed by inoculating SKOV3 cells into nude mice. All the data represent the means ± SD; *p < 0.05, **p < 0.01, and ***p < 0.001

