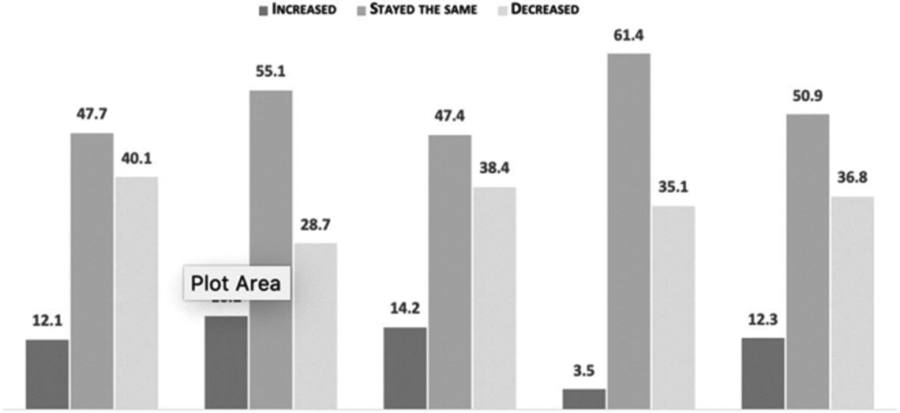
Table 2:
Percent change in trustworthiness of sources of COVID-19 information among respondents who completed surveys in March and July 2020 (N=592)
 | |||||
|---|---|---|---|---|---|
| Model 1: CDC | Model 2: Johns Hopkins University | Model 3: Health Department | Model 4: White House | Model 5: Mainstream News | |
| N = 593 | N (%) | N (%) | N (%) | N (%) | N (%) |
| High Trust in March, 2020 | 482 (81.3) | 494 (83.3) | 446 (75.2) | 174 (29.3) | 378 (63.7) |
| High Trust in July, 2020 | 378 (63.7) | 452 (76.2) | 378 (63.7) | 85 (14.3) | 203 (34.2) |
