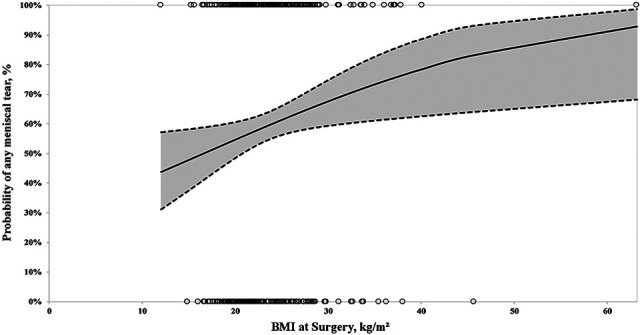
Figure 2.

Predicted probability plot of any meniscal tear by body mass index (BMI). Circles represent the BMIs of individual patients who did have a meniscus tear (circles along 100% line) and did not have a meniscus tear (circles along 0% line). The solid line represents the predicted probability of any meniscus tear for each given BMI. The dashed lines represent the standard error of the predicted probability.
