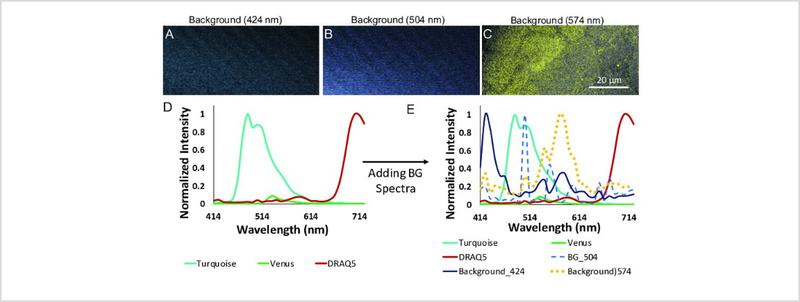
Figure 4: Background spectral signatures were identified and included into the spectral library to account for background fluorescence signals during the unmixing process.
A, B) Two background fluorescence spectral signatures were observed when characterizing a sample blank (unlabeled coverslip). These spectral signatures were named based on their peak wavelengths – one at 424 nm (from coverslip fluorescence) and the other at 504 nm (likely from reflectance or back scatter). C) A third background spectral signature was observed with a peak emission wavelength of 574 nm when non-labeled cells were analyzed, potentially from cellular autofluorescence or fluorescence of the underlying matrix. D) Background spectra extracted from images A, B, and C. These three background spectra were added to the existing 3-component library (Figure 3J) to develop a 6-component spectral library.

