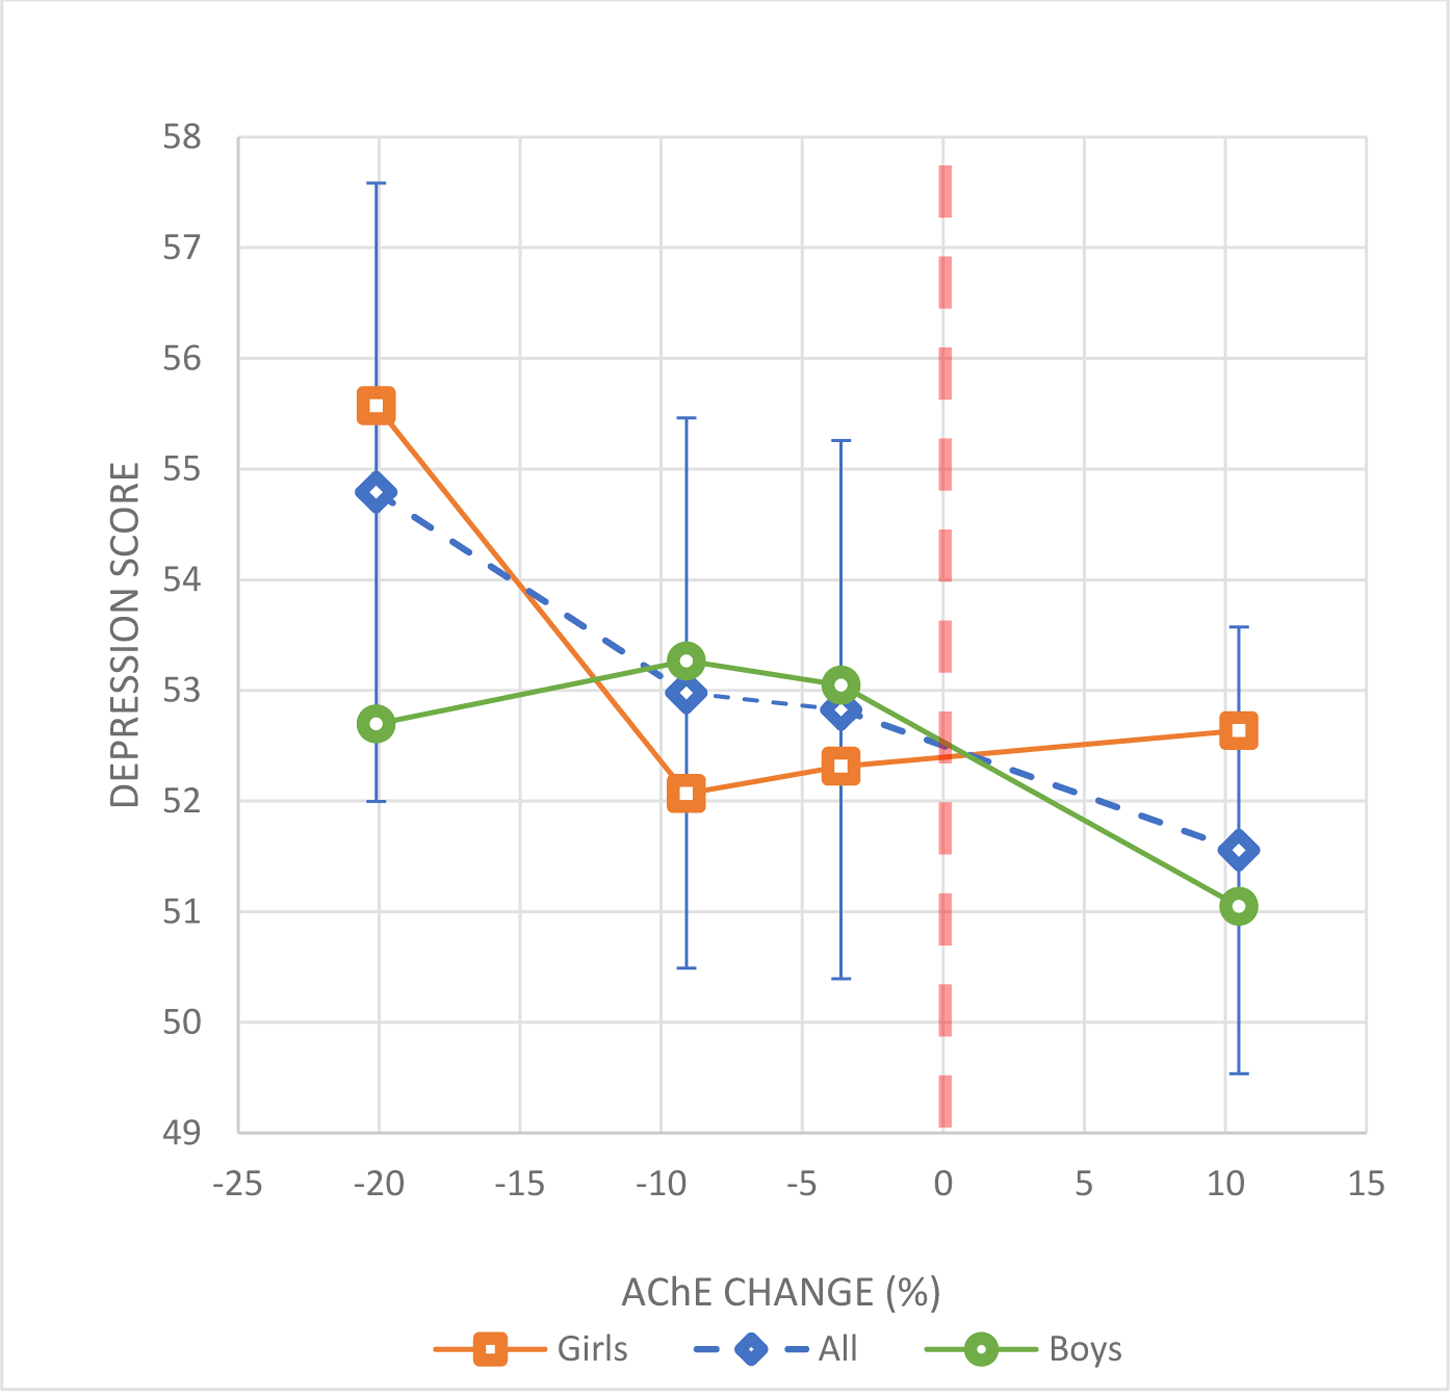
Figure 2.

Change of AChE activity between 2 agricultural seasons and depression scores in adolescents.
Markers (squares, diamonds or circles) correspond to the mean depression scores for the following categories of AChE change: 1) −34% to −12.5%, 2) −12.4 to −6.5%, 3) −6.4% to <0.0% and 4) ≥0.0%. Error bars correspond to the 95% CI for the means for all participants. Error bars for boys and girls are not shown to improve visualization.
Lines between AChE change categories were plotted to improve visualization of the associations.
Adjustments: age, gender, AChE concentration at baseline, hemoglobin concentration (baseline and follow-up), z-score for height-for-age, z-score for BMI-for-age, and family income.
