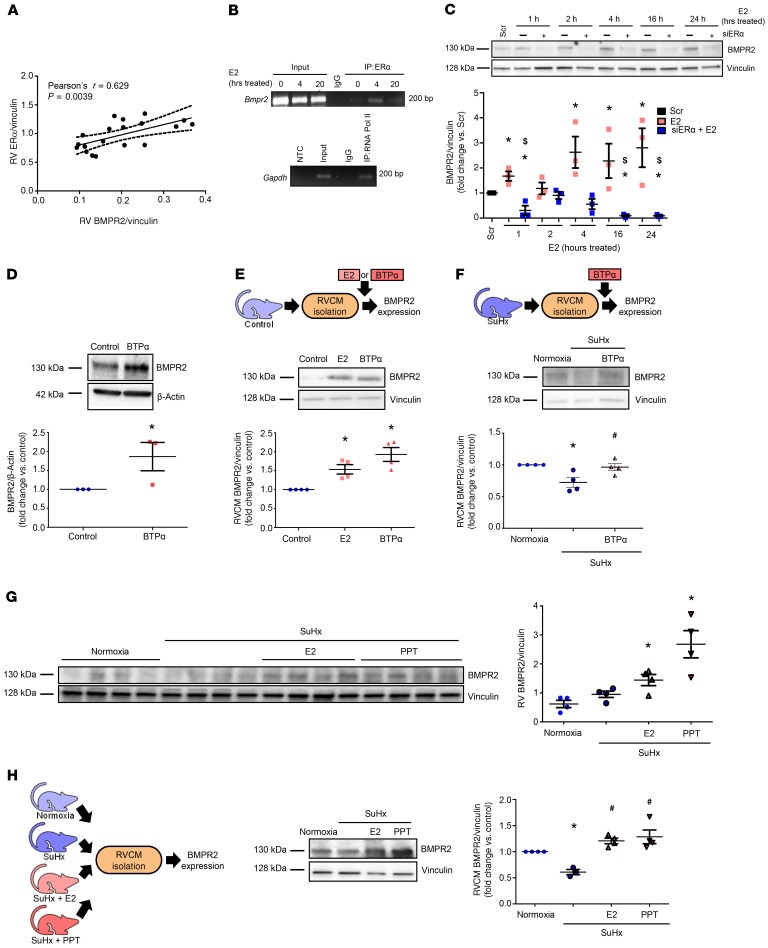
Figure 10. ER-α binds to Bmpr2 promoter and is necessary and sufficient to increase RV BMPR2 in vitro and in vivo.
(A) RV BMPR2 and ER-α protein correlate positively in male and female control and SuHx-PH rats. (B) ChIP of ER-α binding at the Bmpr2 promoter. H9c2 cardiomyoblasts were treated with E2 (100 nM) for 0 (control), 4, or 20 hours. DNA/protein complexes were cross-linked and immunoprecipitated with anti–ER-α antibody or IgG isotype control. RNA polymerase II (RNA Pol II) binding to Gapdh promoter was used as positive control (bottom panel). NTC: no template control. (C) Time course of BMPR2 expression in H9c2 cardiomyoblasts after ER-α siRNA knockdown (5 nM; 24 hours prior to E2 [100 nM]; see Figure 4B for ER-α knockdown efficacy). (D) BMPR2 protein in H9c2 cells treated with ER-α agonist BTP-α (100 nM, 24 hours). (E) BMPR2 protein in RV cardiomyocytes (RVCMs) isolated from male rats and treated with E2 (10 nM, 24 hours) or BTP-α (100 nM, 24 hours) in vitro. (F) BMPR2 protein in RVCMs isolated from male and female SuHx-PH rats and treated in vitro with BTP-α (100 nM, 24 hours). (G) BMPR2 expression in RV homogenates from male normoxia, SuHx-PH, or SuHx-PH rats treated with E2 or ER-α agonist PPT (75 or 850 μg/kg/day; s.c. pellets). (H) BMPR2 protein in RVCMs from groups shown in F. n = 3 independent experiments in B–D; n = 4 rats/group in E–H. B–G depict representative Western blots. Densitometries include data from all experiments or animals. Pearson’s R value and P value shown in A. Dashed lines represent 95% CI. *P < 0.05 versus Scr (scrambled control), $P < 0.05 versus E2 in C; *P < 0.05 versus control or normoxia in D–H; #P < 0.05 versus untreated SuHx in F and H. P values in B, C, and E–H by ANOVA/post hoc Tukey correction; P value in D by Student’s t test. Error bars represent mean ± SEM; each data point represents 1 experiment/animal.

