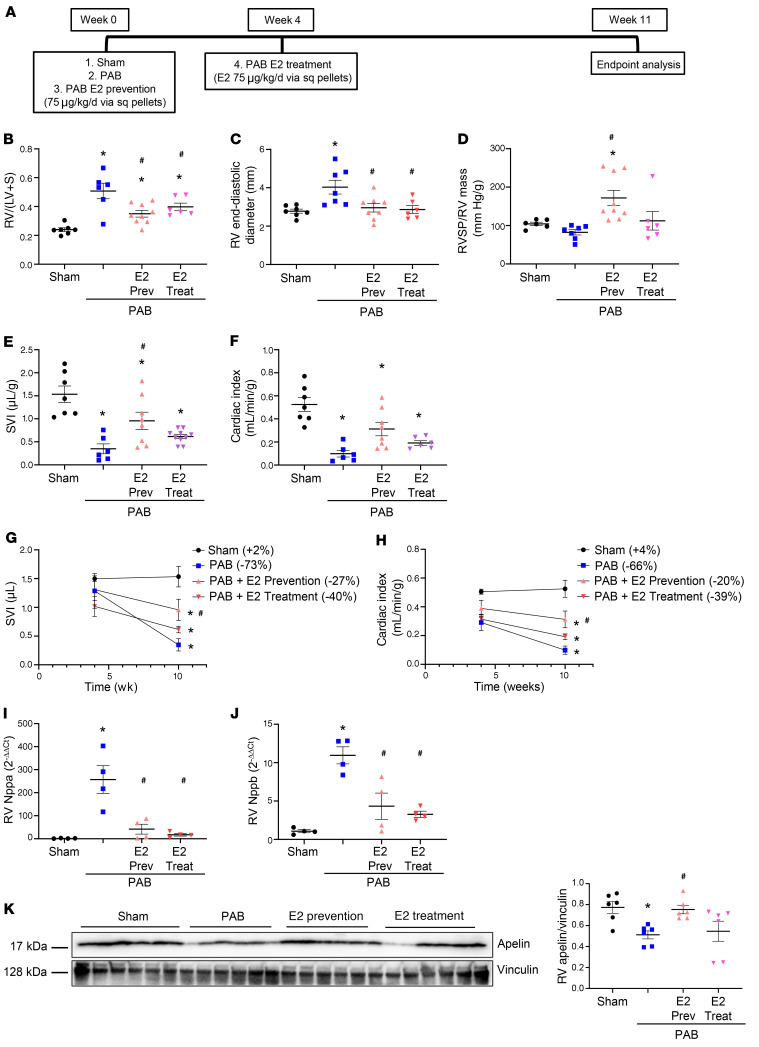
Figure 13. E2 prevents and rescues RV failure induced by pulmonary artery banding.
(A) Experimental design. (B–H) Effects of E2 treatment on RV hypertrophy (RV weight divided by weight of left ventricle plus septum; RV/[LV + S]; B), RV end-diastolic diameter (C), RV systolic pressure (RVSP) normalized for RV mass (D), stroke volume index (SVI; E) and cardiac index (F). SVI and cardiac index were determined echocardiographically. (G–H) Time courses of SVI and cardiac index. Percentage change in SVI and cardiac index versus 4-week baseline time point is shown in legends in parentheses behind group names. (I–J) Effects of E2 treatment on atrial natriuretic peptide (Nppa, I) and B-type natriuretic peptide (Nppb, J) by real time RT-PCR. (K) Quantification of RV apelin by Western blot and densitometric analysis. *P < 0.05 versus sham control, #P < 0.05 versus untreated PAB (1-way ANOVA with Tukey’s or Dunnett’s post hoc correction). Each data point in B–F and I–K represents 1 male animal. Error bars represent mean ± SEM. Sq = subcutaneous; Prev = prevention group; Treat = treatment group.

