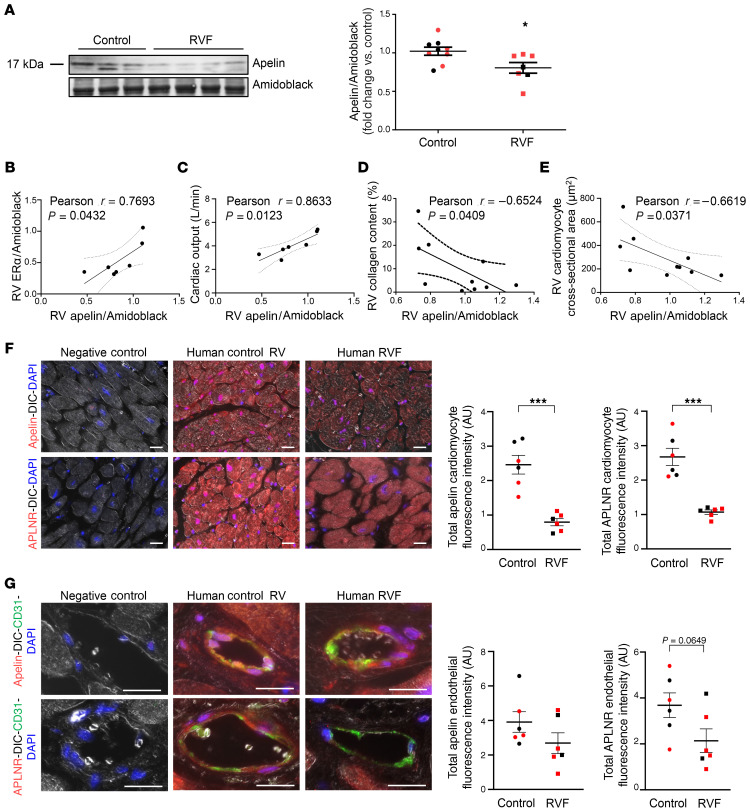
Figure 2. RV cardiomyocyte apelin and apelin receptor (APLNR) expression are decreased in patients with RV failure.
(A) Apelin expression in human RV tissue measured by Western blot. Quantification by densitometry shown on right. (B–E) Apelin expression correlates positively with ER-α protein (B) and cardiac output (C) in RVs from patients with RV failure (RVF) and negatively with RV collagen content (D; expressed as percentage of RV cross-section) and RV cardiomyocyte size (E; measured as cardiomyocyte cross-sectional area [CSA]) in human control RVs and RVs from RVF patients. Cardiac output data was available for RVF patients only. RV collagen content and RV cardiomyocyte size were analyzed in a randomly selected subgroup of control subjects. (F) Representative immunohistochemistry images of cardiomyocyte apelin and APLNR expression in human control RVs and RVs from patients with RVF. Cardiomyocyte localization was established by differential interference contrast (DIC). Cardiomyocyte apelin or APLNR fluorescence intensity is quantified in graphs. Images are at 20× magnification; scale bars: 20 μm. (G) Representative immunocytochemistry images of endothelial cell apelin and APLNR expression and localization in human control RVs and RVs from patients with RVF. Endothelial cell localization was established by colocalization with CD31. Apelin or APLNR fluorescence intensity is quantified in graphs. Images are at 40×, scale bars: 20 μm. Red and black symbols in graphs represent female and male samples, respectively. (A, F, and G) *P < 0.05, ***P < 0.001 versus control by Student’s t test. Error bars represent mean ± SEM. (B–E) Pearson’s R value and P value shown. Dashed lines represent 95% CI.

