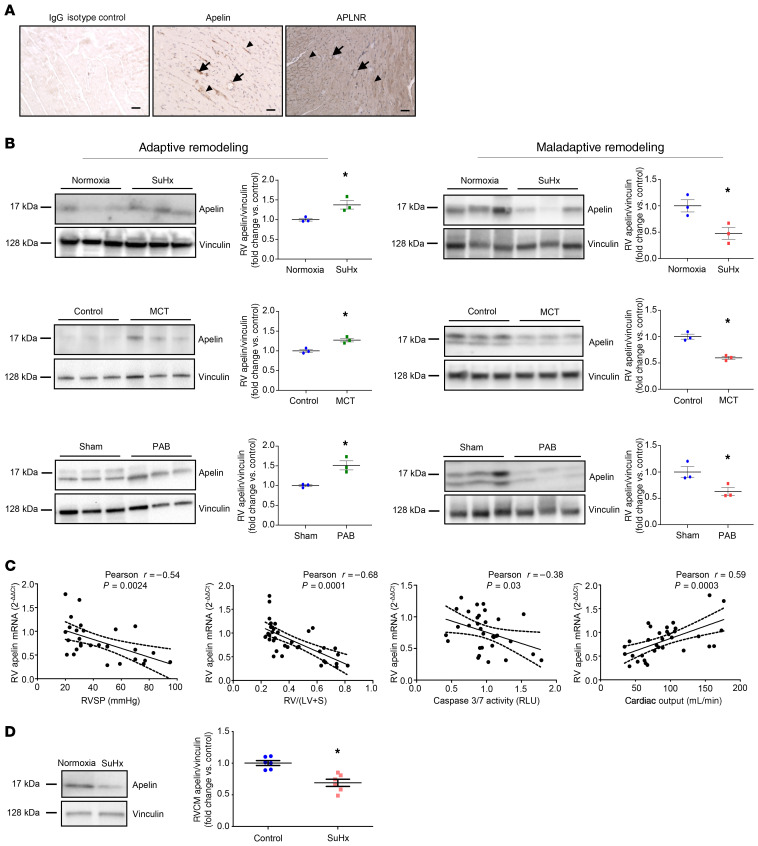
Figure 3. RV apelin expression is decreased in maladaptive (but not adaptive) RV hypertrophy and correlates negatively with markers of worsening RV function.
(A) Apelin and APLNR are expressed in the RV. Apelin (middle image) and APLNR (right image) stained by immunohistochemistry in the RV of a male Sprague-Dawley rat. Both apelin and APLNR are expressed in coronary endothelial cells (arrows) as well as cardiomyocytes (arrowheads). Images are 10×; scale bars: 50 μm. (B) Apelin expression by Western blot and quantified via densitometric analyses in RVs from rats with adaptive remodeling (characterized by preserved cardiac output; left panel) or maladaptive remodeling (characterized by reduced cardiac output; right panel) employing rats with SuHx-PH, monocrotaline-induced PH (MCT), or pulmonary artery banding (PAB). Note decrease in apelin in maladaptive but not adaptive RV hypertrophy. n = 3 male rats/group. (C) Apelin mRNA correlates negatively with RV systolic pressure (RVSP), RV hypertrophy [RV weight divided by weight of left ventricle + septum; RV/(LV + S)], and proapoptotic signaling (caspase-3/7 activity; in relative light units [RLU]), but positively with cardiac output in male and female control rats and rats with SuHx-PH (hemodynamics described in ref. 14). (D) Apelin expression in RV cardiomyocytes (RVCMs) isolated from normoxia control or SuHx-PH male and female rats. A representative Western blot is shown on the left; densitometry is shown on the right. *P < 0.05 by Student’s t test in B and D. Error bars in B and D represent mean ± SEM; each data point represents 1 animal. Correlation analyses in C performed by determining Pearson’s correlation coefficient (R) and 2-tailed P value. Dashed lines represent 95% CI.

