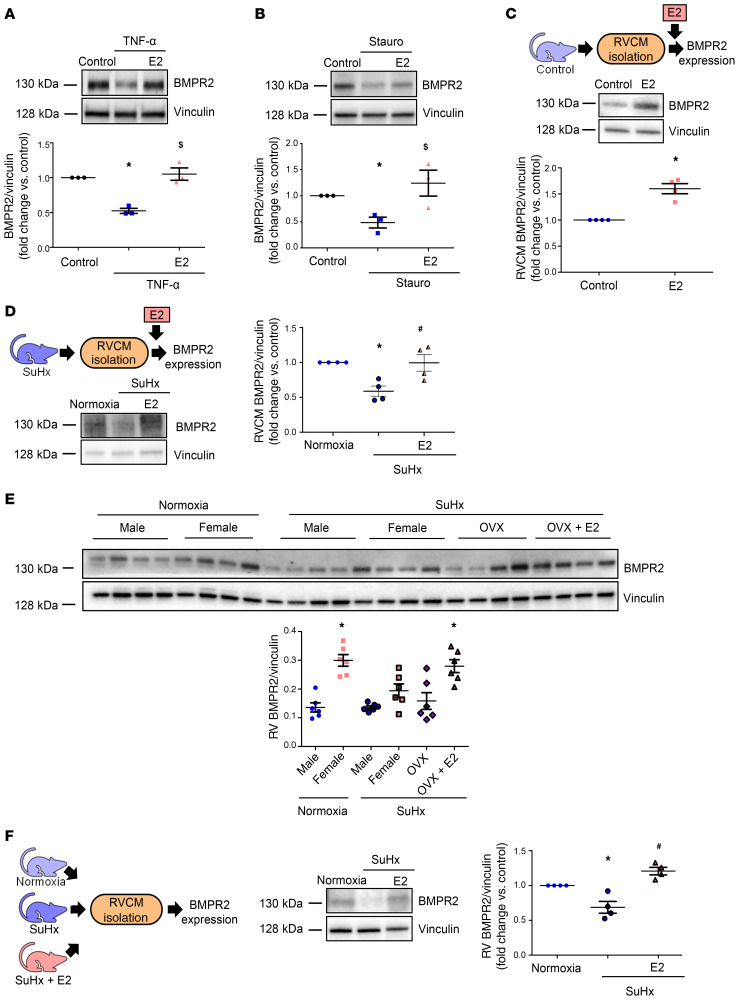
Figure 9. E2 upregulates BMPR2 in stressed cardiomyoblasts, in SuHx-PH RVs, and in RV cardiomyocytes.
(A and B) Effects of E2 on BMPR2 expression in H9c2 cardiomyoblasts treated with TNF-α (10 ng/ml, 8 hours; (A) or staurosporine (stauro; 50 nM, 4 hours; (B). Cells were pretreated with E2 (100 nM) for 24 hours prior to TNF/stauro exposure and then lysed and analyzed by Western blot. (C) Western blot of BMPR2 expression in RVCMs isolated from male control rats treated with E2 in vitro (10 nM, 24 hours). (D) Western blot of BMPR2 expression in RVCMs isolated from male and female SuHx-PH rats and treated in vitro with E2 (10 nM, 24 hours). (E) Effects of endogenous or exogenous E2 on RV BMPR2 expression. SuHx-PH was induced in male, intact female, and ovariectomized (OVX) female rats. A subgroup of OVX females was replete with E2 (75 μg/kg/day via s.c. pellets for 7 weeks). Note higher baseline BMPR2 expression in female controls compared with males and increased RV BMPR2 protein abundance after E2 treatment. (F) BMPR2 expression evaluated by Western blot in RVCMs isolated from male normoxic control rats, untreated SuHx-PH rats, and SuHx-PH rats treated with E2 (75 μg/kg/day; s.c. pellets) for 7 weeks. n = 3 independent experiments in A and B; cells isolated from n = 4 rats/group in C, D, and F, with each data point indicating 1 animal; n = 6 rats/group in E. Figures depict representative Western blots with densitometric analyses for all experiments. *P < 0.05 versus untreated control, $P < 0.05 versus TNF or stauro treatment in A and B; *P < 0.05 versus untreated control in C; *P < 0.05 versus normoxia control, #P < 0.05 versus untreated SuHx in D and F. *P < 0.05 versus male normoxic control in E. All P values by ANOVA with post hoc Tukey correction except for C, where P value is by Student’s t test. Error bars represent mean ± SEM; each data point represents 1 experiment or animal.

