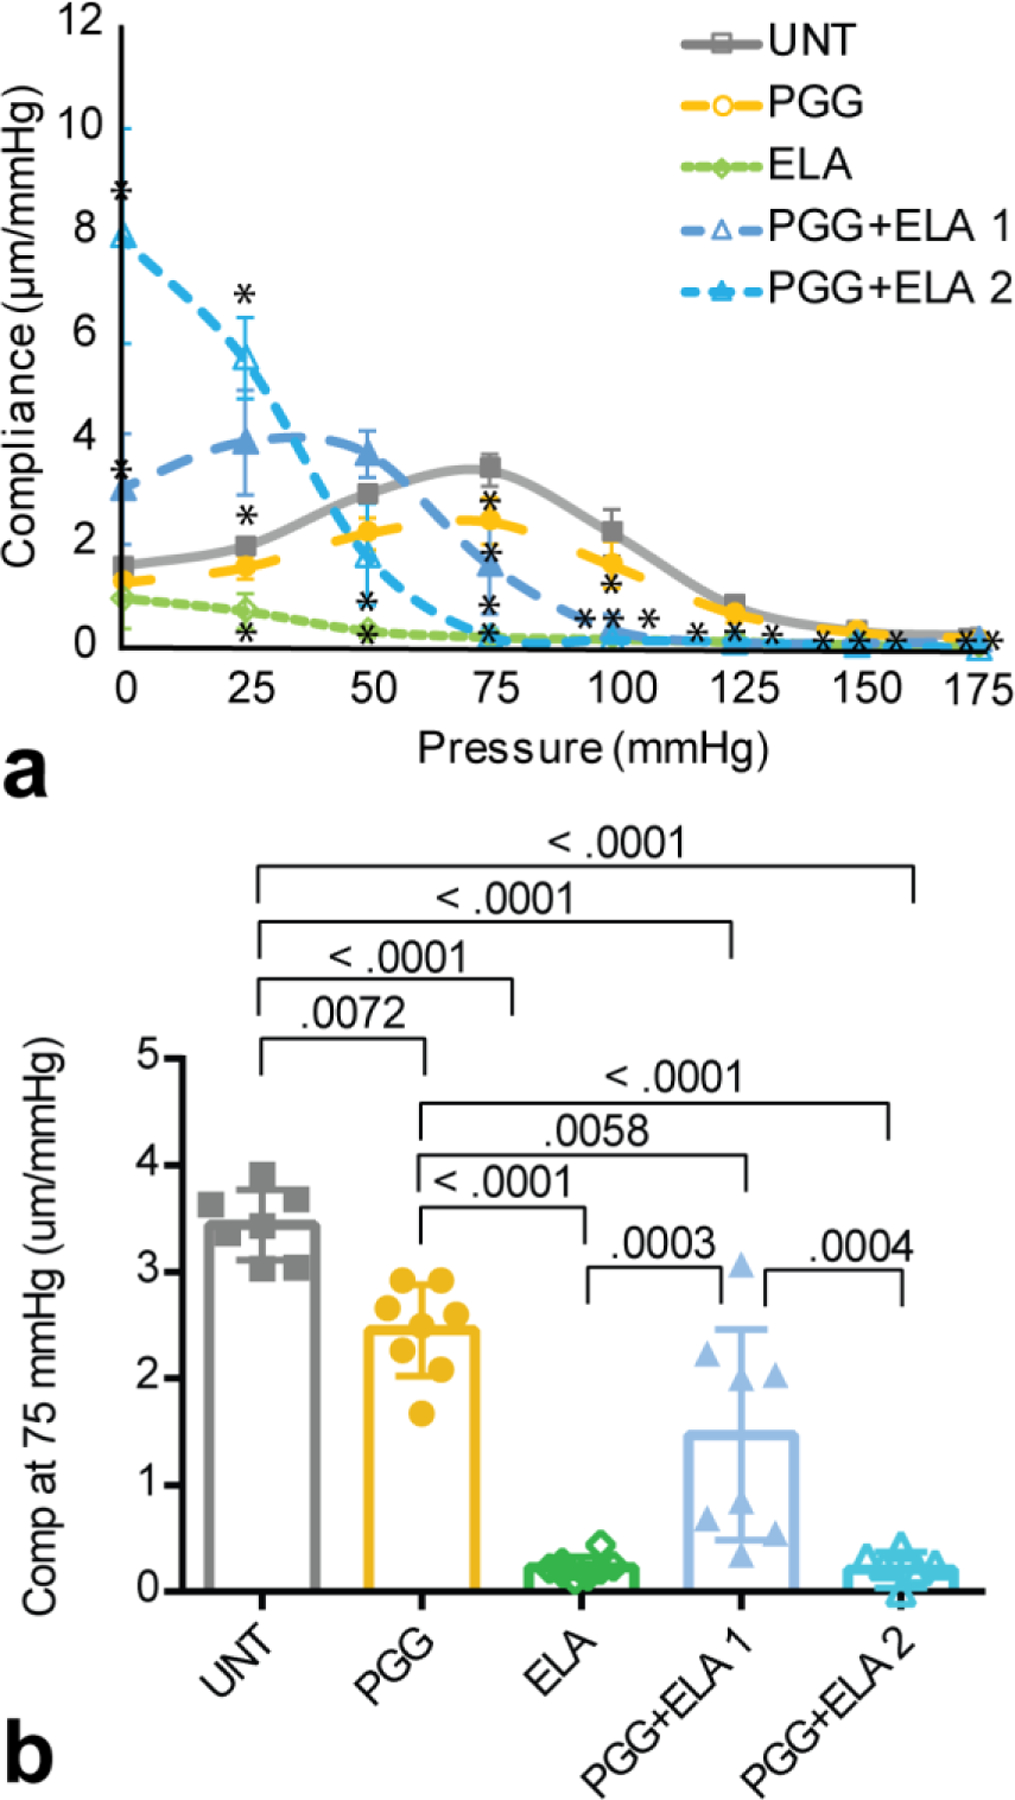
Fig. 3.

Compliance of mouse carotid arteries for different treatment groups. a) Average pressure-compliance behavior for UNT, PGG, ELA, PGG+ELA 1, and PGG+ELA 2 groups. N = 7 – 8 for all groups. Mean ± SD. * indicates P < 0.05 compared to UNT by ANOVA followed by Tukey’s posthoc test. All individual comparisons and P values are in Online Table 4. b) Compliance at 75 mmHg with individual statistical comparisons for significant P-values. Individual data points and mean ± SD are shown.
