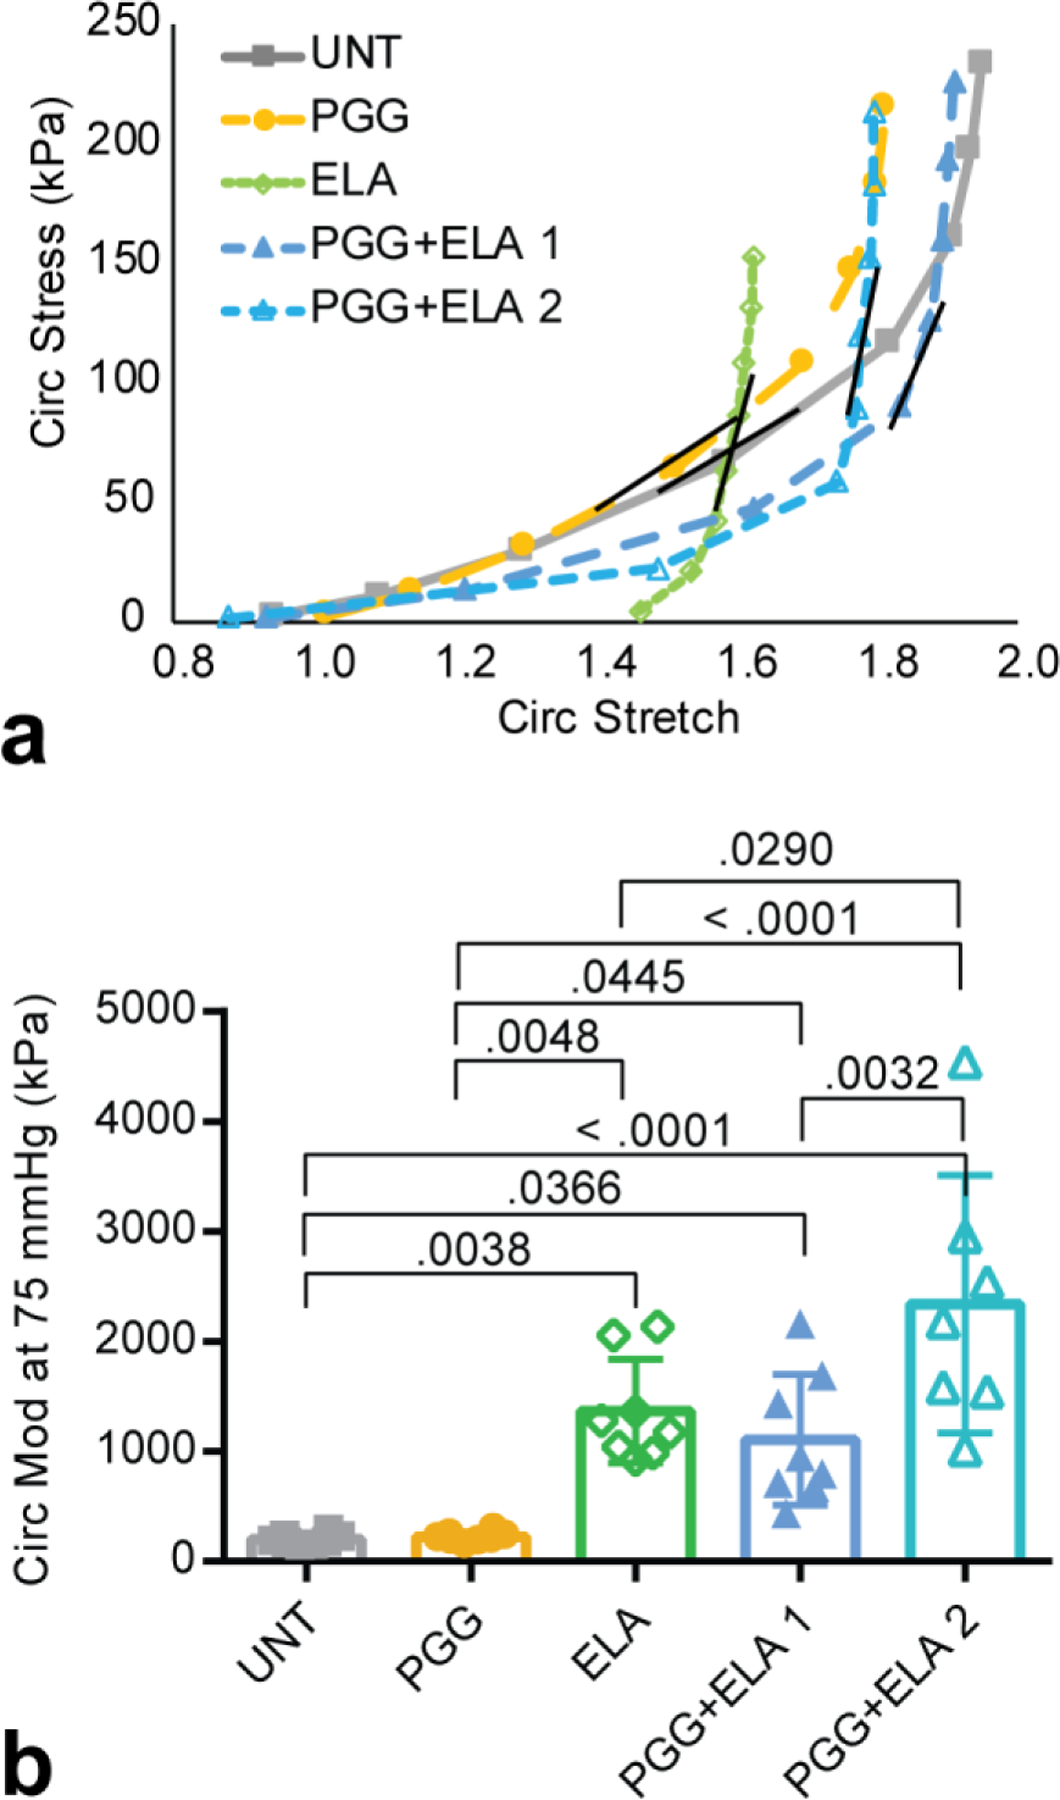
Fig. 5.

Stretch-stress behavior and tangent modulus of mouse carotid arteries for different treatment groups. a) Average circumferential stretch versus stress. Error bars were removed for clarity. The short black line on each curve represents the approximate location where the tangent modulus was calculated at a pressure of 75 mmHg. b) Tangent modulus at 75 mmHg. N = 7 – 8 for all groups. Individual data points and mean ± SD are shown. Significant P values are shown from ANOVA followed by Tukey’s posthoc test.
