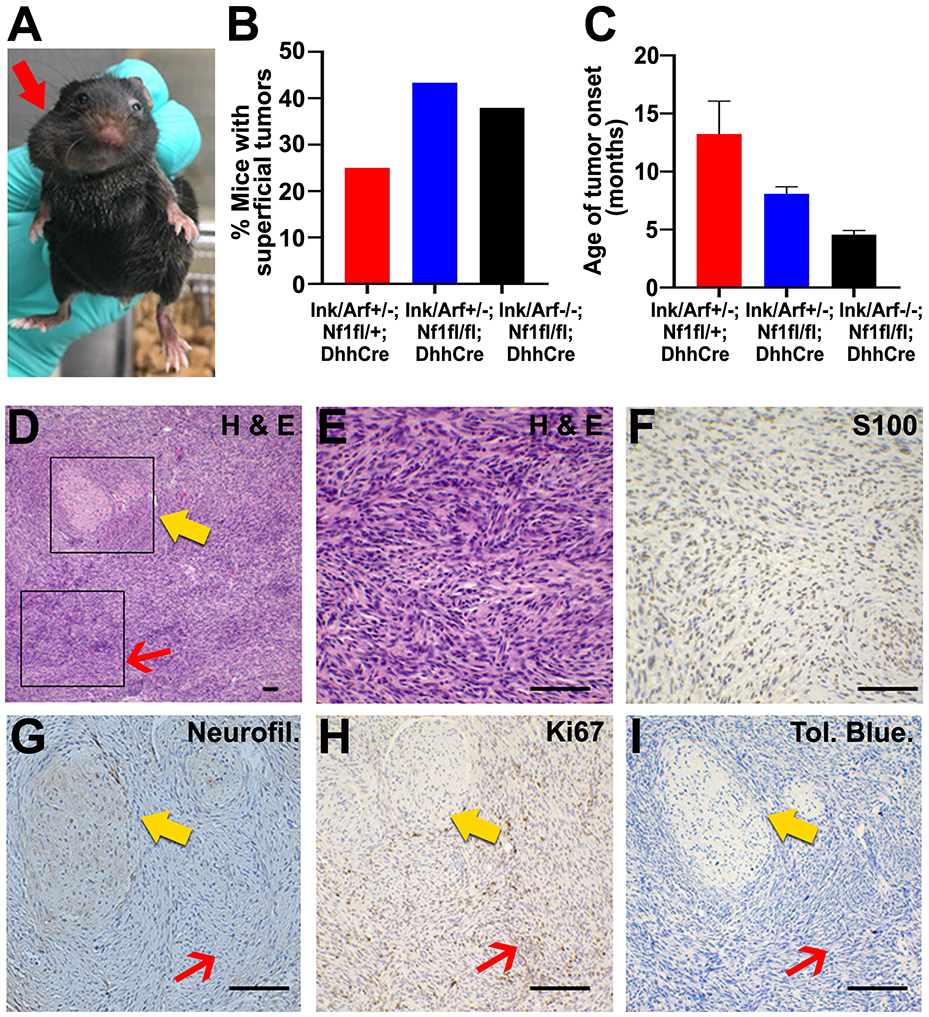
Figure 3. Superficial GEM-PNST develop in Ink4a/Arf;Nf1fl/fl;DhhCre mice.

A. Photographs of Ink4a/Arf+/−;Nf1fl/fl;DhhCre mouse with large superficial craniofacial mass (red arrow). B. Quantification of the percent of mice which develop superficial craniofacial, dorsal, or shoulder tumors for each genotype. C. Average age of superficial tumor occurrence in each genotype. D. Paraffin section from superficial tumor stained with H&E. Box I, red arrow highlights high grade histology. Box II, yellow arrow highlights lower grade tumor with retained collagen, nuclear atypia and absence of mitoses and adjacent areas of tumor progression. 10x. E. Box I enlargement, H&E stained section shows hypercellularity with overcrowding and nuclear atypia, and mitotic figures (>3/10 HPF) in minimal collagenous background. F. Box I, Anti-S100 immunoreactivity is partially lost, representing reduced SC differentiation. 40x. G. Box II, Anti-neurofilament staining is preserved in the PN (yellow arrow) and absent within high grade areas (red arrow). 40x. H. Box II, Ki67 staining shows that proliferation is low in PN (yellow arrow) and increased in high grade GEM-PNST (red arrow). 40x. I. Box II, Tol Blue. Mast cells (purple) are scattered throughout PN (yellow arrow) and tumor (red arrow). 40x. Scale bar, 50 μm for D – I.
