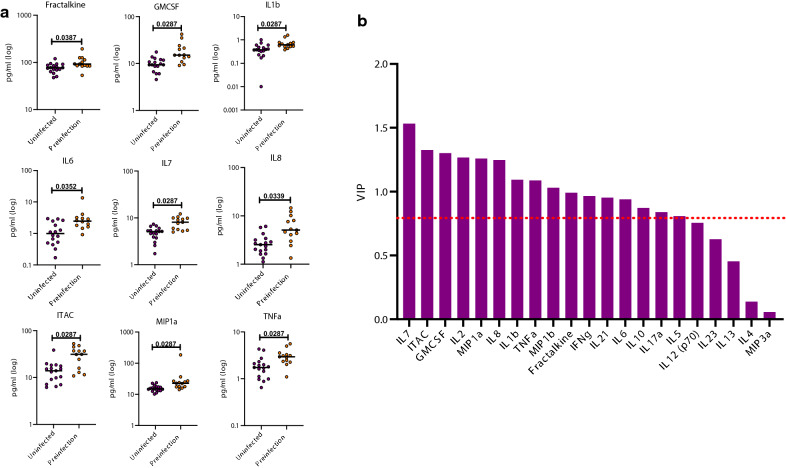
Fig. 4.
Circulating biomarkers in the Rwanda cohort: preinfection individuals have significantly higher cytokines and chemokine levels compared to the uninfected group. a The levels of cytokines and chemokines were separated by the country of origin and the uninfected (purple) and preinfection (orange) groups were compared (Kolmogorov-Smirnov test, two-tailed, FDR adjusted p-values). b Partial Least Square (PLS) Analysis for the Rwandan cohort. Analysis was done with NIPALS Fit with 1 Factor. VIP (Variable Importance Plot) Threshold was set at 0.8. PLS analysis for Rwandan cohort. ITAC, GMCSF, Fractalkine, IFNg, IL-10, IL-17a, IL-1b, IL-2, IL-21, IL-5, IL-6, IL-7, IL-8, MIP-1a, MIP-1b, and TNFa were the biomarkers that caused preinfection profile in Rwanda

