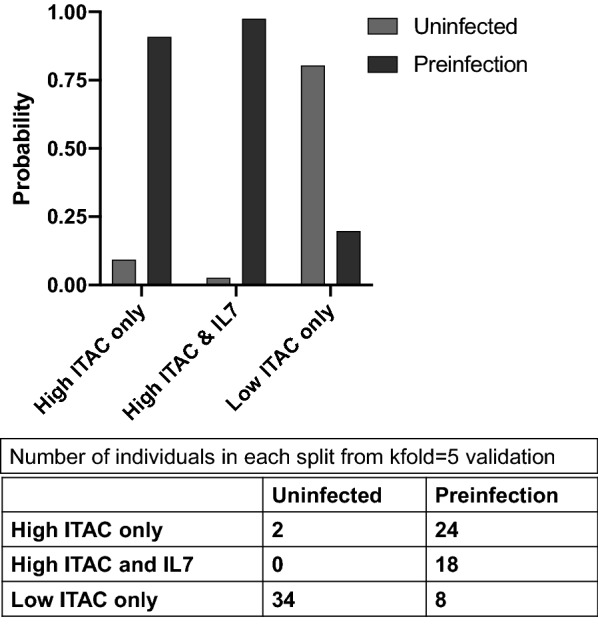
Fig. 7.

Kfold validation model identifies elevated ITAC and IL-7 levels as markers for preinfection from combined Rwandan and Zambian cohorts. Two splits were performed to find biomarkers associated with preinfection. The bar graph shows the response probability for the multiple splits performed in the model. The model found that elevated ITAC identified preinfection individuals with a probability of 0.9077 and elevated ITAC and IL-7 identified preinfection individuals with a probability of 0.9744. Lower levels of ITAC were found identify uninfected individuals. Uninfected (gray) and preinfection (maroon). The table shows the number of individuals from the total cohort that fall into each split performed by the model (kfold = 5)
