
Fig. 4.
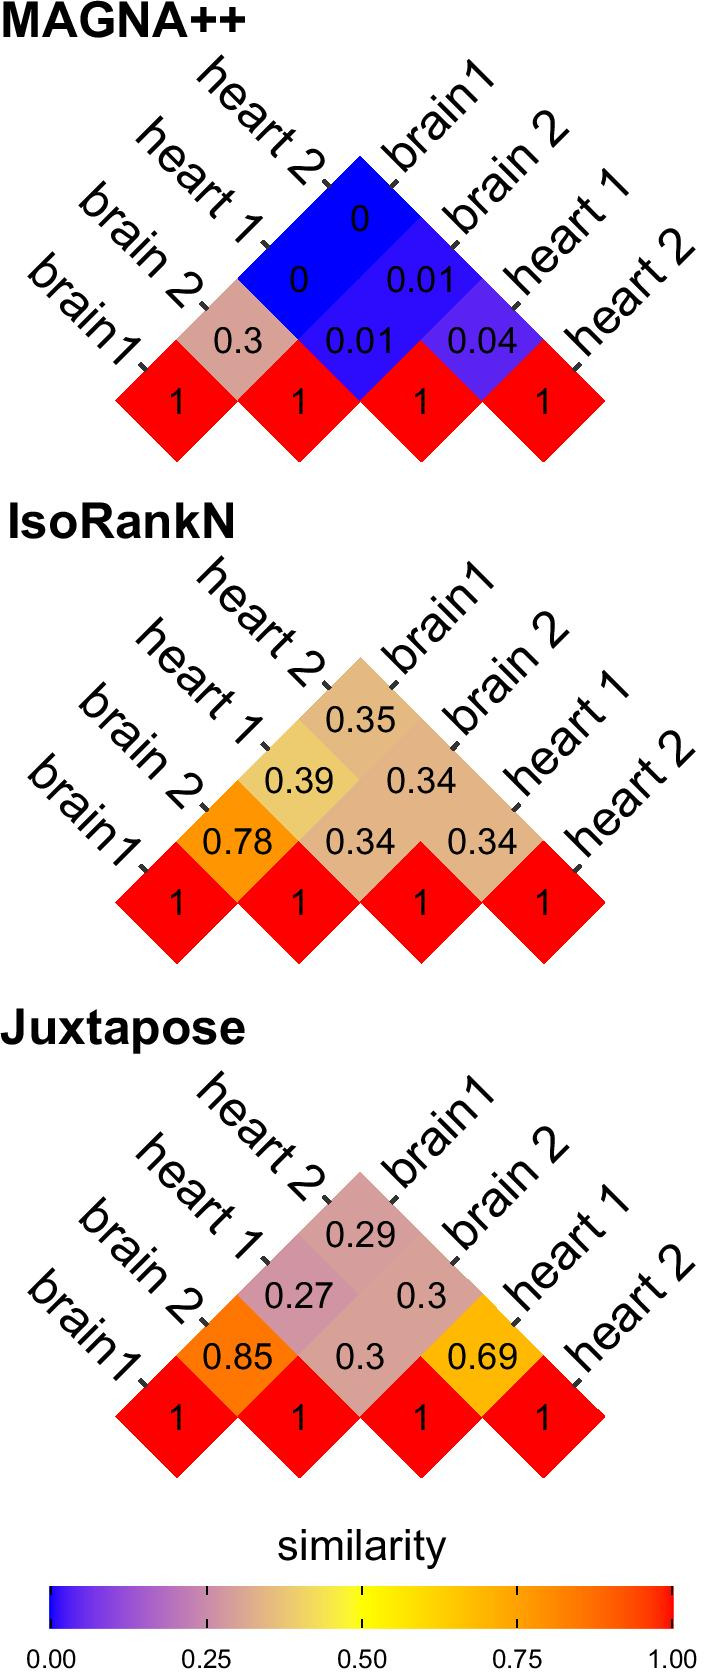
Pineplot illustrating the proportion of genes matched between heart and brain networks compared using (from top to bottom) MAGNA++, IsoRank, and Juxtapose. The pineplot was constructed using the pineplot R package v 0.0.9 [60]
Official websites use .gov
A
.gov website belongs to an official
government organization in the United States.
Secure .gov websites use HTTPS
A lock (
) or https:// means you've safely
connected to the .gov website. Share sensitive
information only on official, secure websites.
Pineplot illustrating the proportion of genes matched between heart and brain networks compared using (from top to bottom) MAGNA++, IsoRank, and Juxtapose. The pineplot was constructed using the pineplot R package v 0.0.9 [60]