Fig. 3.
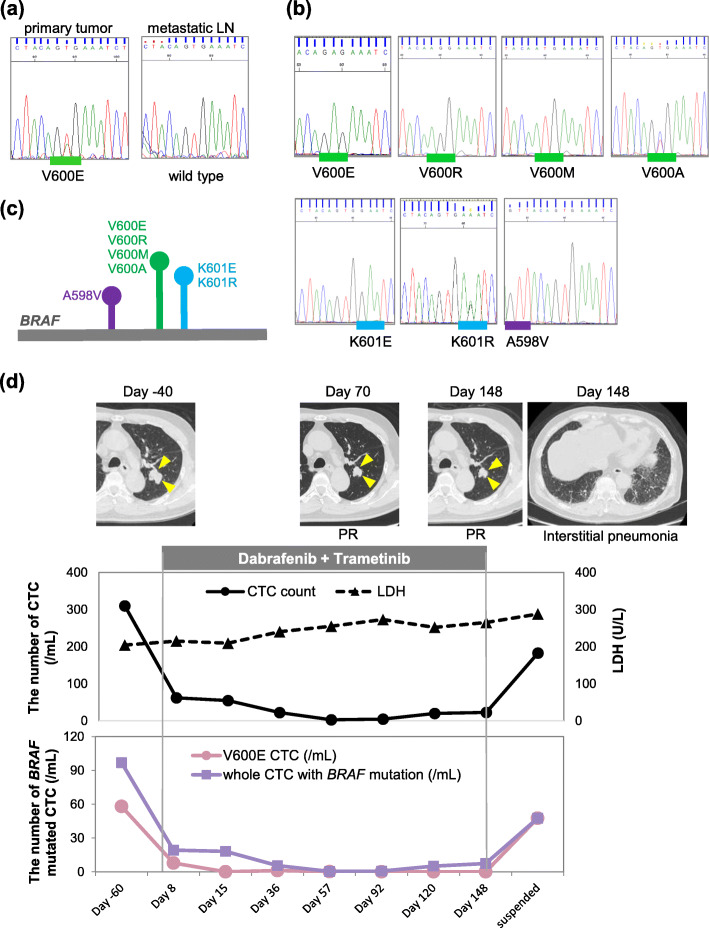
BRAF genotype and the number of CTCs in MMbraf5. a BRAF sequence chromatograms of the primary tumor and a metastatic lymph node. b BRAF sequence chromatograms of CTCs during treatment with BRAF/MEK inhibitors. c Diversity of BRAF mutations surrounding codon 600 in MMbraf5. d Number of CTCs during treatment and clinical outcome response in patient MMbraf5. Arrowheads indicate lung metastasis in CT imaging on Days − 40, 70, and 148. Far-right CT imaging shows the appearance of interstitial pneumonia on Day 148. In the upper graph, solid and dotted lines indicate the number of total CTCs and the LDH level, respectively, during the clinical course in MMbraf5. In the lower graph, pink and purple lines indicate the numbers of BRAFV600E CTCs and total CTCs with BRAF mutations, respectively

