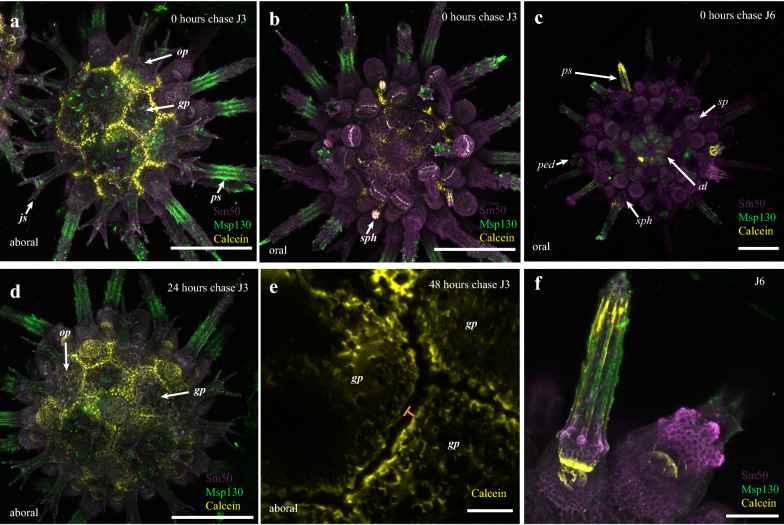
Fig. 3.
Skeletogenesis in juvenile P. lividus. a Localization of Sm50 (purple), Msp130 (green) and incorporation of calcein (yellow) in aboral surface of J3 individual at 0 h chase. b Oral surface of a. c Sm50, Msp130 and calcein in J6 animal at 0 h chase. d Aboral surface of 24 h chase J3 individual. e Zoom of calcein incorporation in margins of aboral plates in 48 h chase J3 individual. Orange bars indicate gap between calcein-marked skeleton due to subsequent accretion. f Close-up of the aboral surface showing incorporation of calcein into growing spines and tubercle. Abbreviations as in Fig. 2 and scale bars in a–d are 200 μm, e is 25 μm, and f is 50 μm

