
Figure 1. Cortical interneurons develop class-specific myelination patterns.
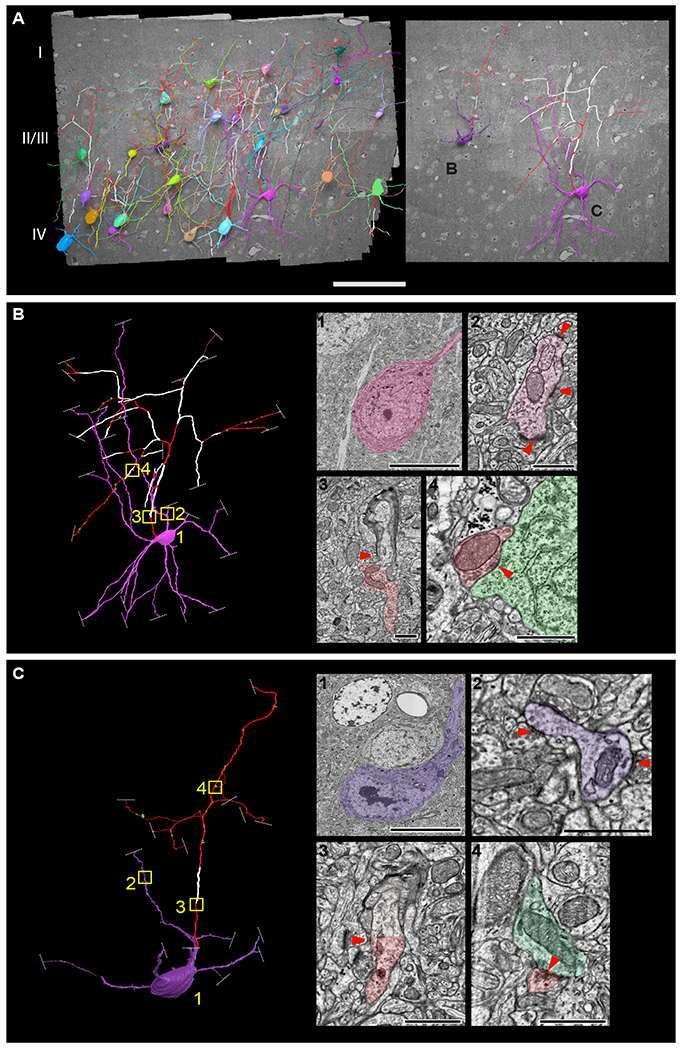
(A) 3D reconstructions of 28 neurons from a high-resolution EM dataset of mouse V1 cortex (Bock et al., 2011), displaying non-myelinated axons (red) and myelinated axons (white). Scale bar 100μm. Image to the right are 3D renderings of two neurons with distinctive morphological features of a cortical basket cell (B) and cortical Martinotti cell (C). (B, C) Close-up renderings of these two cells. Images to the right are representative single EM sections of (1) cell bodies, (2) dendrites with a sparse number of spines receiving multiple shaft synapses, (3) myelinating ascending axon, and (4) axons forming symmetrical synapses (red) with the postsynaptic cell body labeled in green (red arrowheads indicate the location of axons, synapses onto dendrites, and asymmetrical synapses). Boxed regions on the 3D rendered images (yellow) indicate the location corresponding to the EM images. Dashed white lines indicate the end of EM tracing due to the axon or dendrites leaving the V1 EM volume, or the quality of the EM data precluding further tracing. Scale bars, 10μm for panel 1 and 1μm for panels 2–4. See also Figures S1 and S2 and Table S1.