
Figure 4. Subpopulations of cortical oligodendrocytes show individual bias towards myelinating the axons of inhibitory neurons.
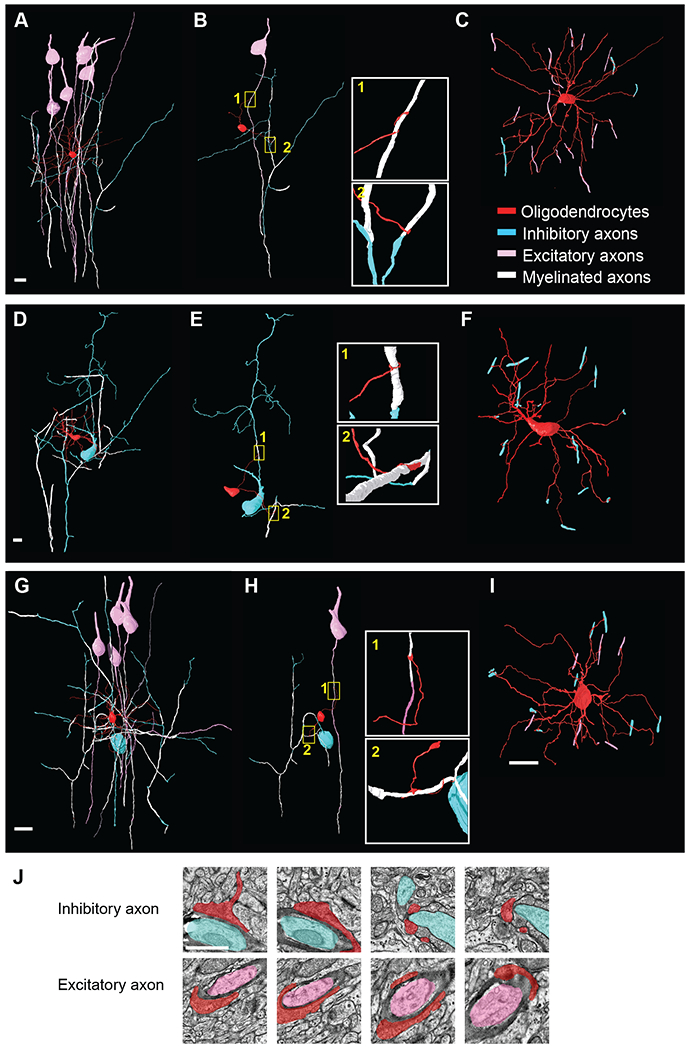
(A-I) 3D reconstruction of oligodendrocyte 2 (A-C, predominantly myelinating axons of excitatory neurons), oligodendrocyte 7 (D-F, myelinating multiple axons of inhibitory neurons) and oligodendrocyte 10 (G-I myelinating both excitatory and inhibitory neurons) from the Bock et al. EM dataset (Figure 3A and Figure 5A). The oligodendrocytes are labeled in red, myelinated axons in white, inhibitory soma and non-myelinated axons in blue, and excitatory soma and non-myelinated axon in pink. (B, E, H) Reconstructions of two of the oligodendrocytes’ processes myelinating the axon of a target excitatory or inhibitory neuron. Boxed images to the right are enlargements of two individual processes ensheathing the target axons. (C, F, I) 3D reconstruction of the oligodendrocyte showing all myelinating contacts with excitatory (pink) and inhibitory axons (blue). Scale bar 10μm. (J) Representative EM images of two processes projecting from oligodendrocyte 10 (red) myelinating individual inhibitory (blue) and excitatory (pink) axons. Scale bar 1μm. See also Figures S4 and S5 and Table S1.