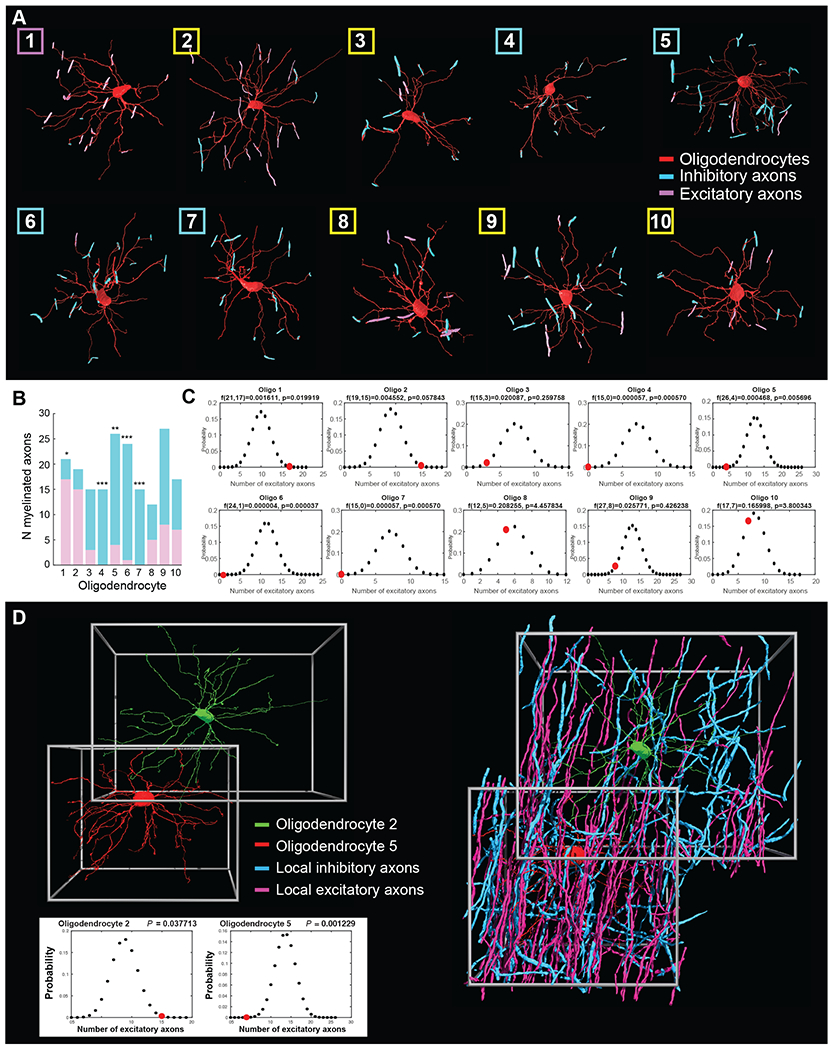
Figure 5. Oligodendrocyte bias towards excitatory versus inhibitory axons is independent of the availability of surrounding excitatory and inhibitory axons.

(A) 3D renderings of 10 oligodendrocytes located in layer II/III of the visual cortex myelinating multiple inhibitory (blue) and excitatory axons (pink). Box color denotes bias towards excitatory (pink) or inhibitory (blue) axons, or no bias (yellow). (B) Graph representing the total number of inhibitory (blue) and excitatory (purple) axons myelinated by each of the 10 traced oligodendrocytes in layer II/III, with asterisks indicating oligodendrocytes where the ratio is significantly different from expected at random. * P < 0.05, ** P < 0.01, *** P < 0.001 (binomial distribution analysis, see Methods and Figure S5). (C) Binomial distribution plots for the 10 oligodendrocytes, comparing the total number of excitatory axons myelinated by each oligodendrocyte (red circles) to the number expected from the ratio of inhibitory and excitatory axons (48% inhibitory and 52% excitatory). (D) Individual oligodendrocytes show bias towards different axon types independent of local axon availability. Left, 3D rendering of oligodendrocytes 2 (green) and 5 (red) demonstrating their proximity and multiple overlapping processes. Right, 3D reconstruction of these cells with all surrounding myelinated axons whose type could be identified; myelinated excitatory axons (pink) and myelinated inhibitory axons (blue). Bottom: binomial distribution plots for oligodendrocyte 2 and 5, comparing the actual number of myelinated excitatory axons (red circles) with the number expected from the average ratio of locally available classifiable myelinated axons (Oligodendrocyte 5: 52% excitatory and 48% inhibitory axons; Oligodendrocyte 2: 46.2% excitatory and 53.8% inhibitory axons). See also Figure S5.
