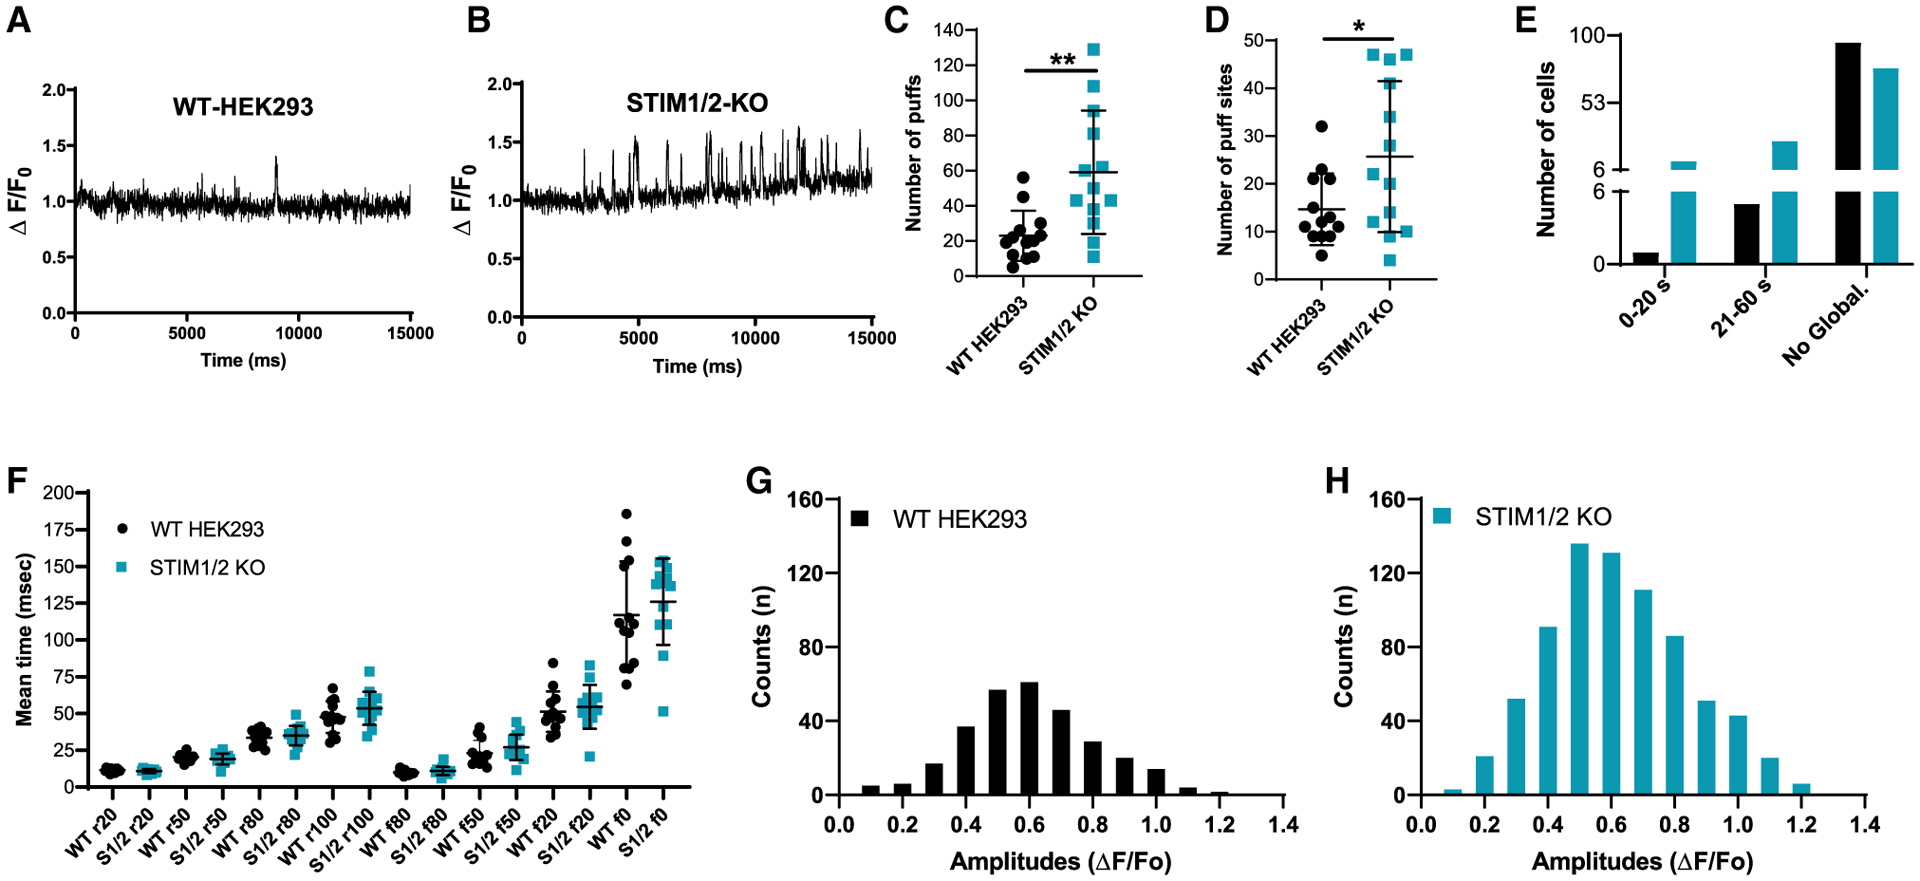
Figure 5. STIM1/STIM2 regulate IP3R-mediated Ca2+ puffs in response to IP3 uncaging.

(A and B) Representative traces of Cal-520 fluorescence ratios (ΔF/F0) from the center of a single puff site (1.3 × 1.3 μm) evoked by photolysis of ci-IP3 at 3 s in WT-HEK293 (n = 12 experiments, 101 cells) and STIM1/2-KO (n = 10 experiments, 115 cells), respectively.
(C and D) 13 cells from each condition were randomly selected to quantify the number of puffs (C) and puff sites (D). (C) n = 768 puffs in 13 STIM1/2-KO cells when compared to n = 298 puffs in 13 HEK293 cells. (D) n = 334 puff sites in 13 STIM1/2-KO cells when compared to n = 191 puff sites in 13 HEK293 cells.
(E) From a total of 101 HEK293 cells and 115 STIM1/2-KO cells, a bar graph shows the proportions of WT-HEK293 and STIM1/2-KO cells in which the Ca2+ signals either did not globalize or globalized within 0–20 or 21–60 s.
(F) Mean rise and decay times of fluorescence of Ca2+ puffs when it increases or decreases to 20%, 50%, 80%, and 100% from 13 cells each of HEK293 and STIM1/2-KO.
(G and H) Amplitudes distribution of the Ca2+ puffs in WT-HEK293 (G) and STIM1/2-KO cells (H). For all figures, *p < 0.05, **p < 0.01.
