
Figure 3:
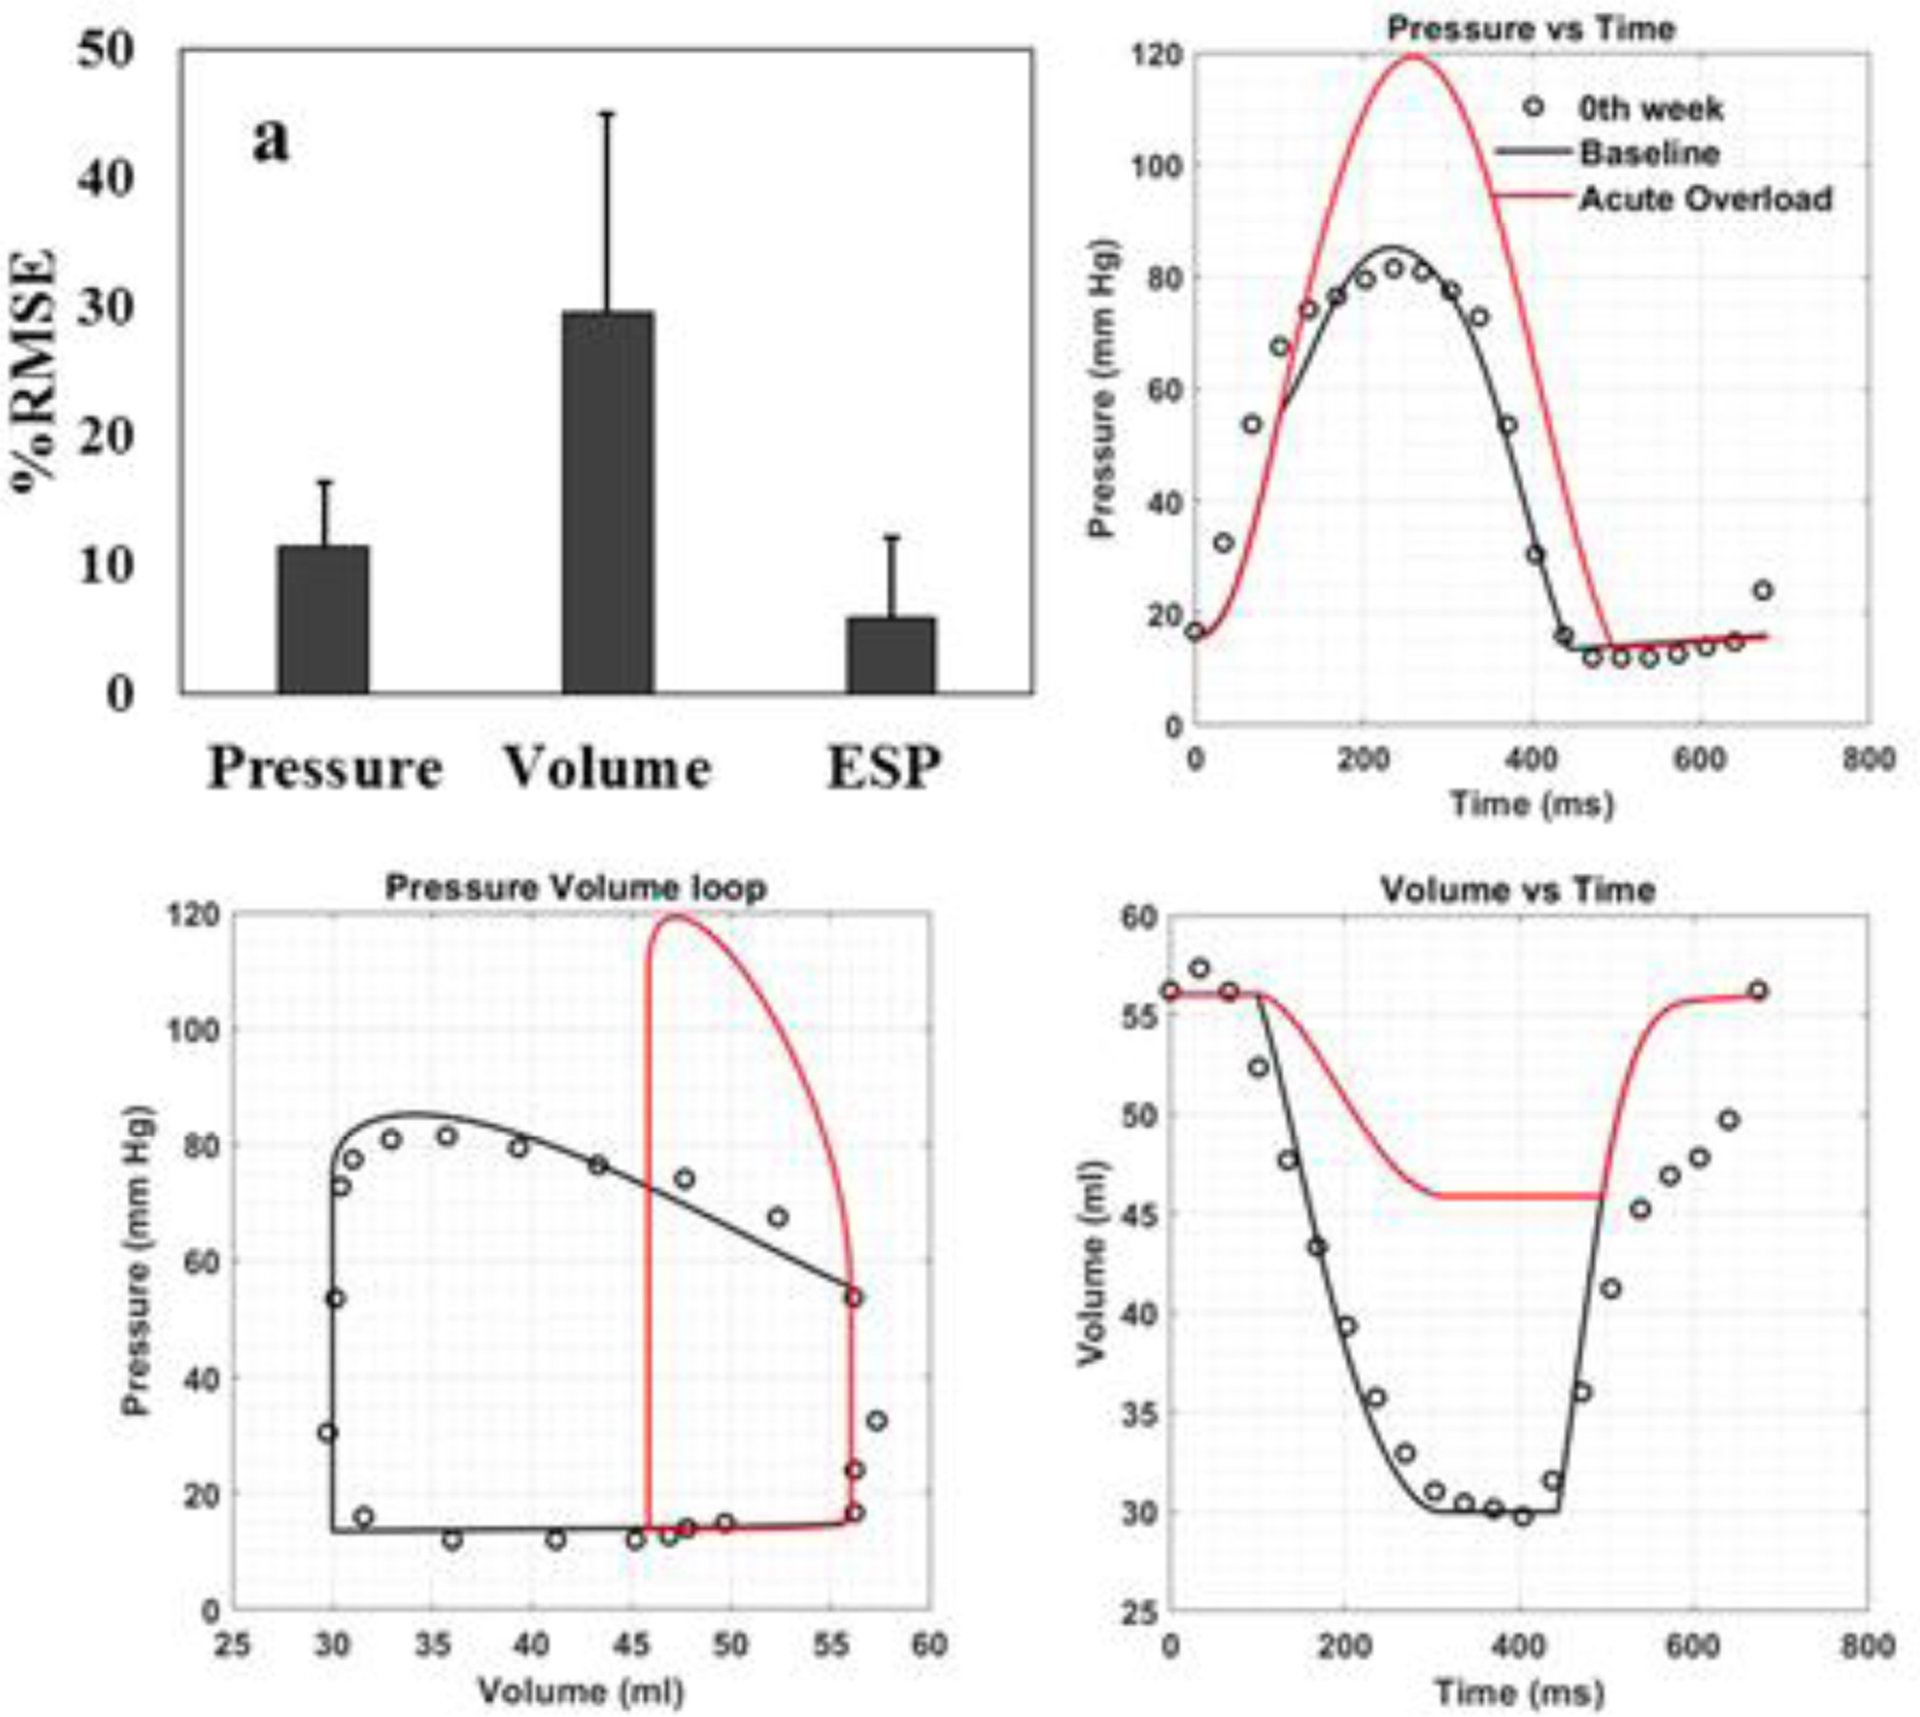
Comparison between model prediction and experimental measurements. (a) RMSE (expressed as mean ± SD) for pressure, volume waveforms and end systolic pressure over a cardiac cycle. (b) Temporal variation in pressure, (c) Pressure-volume relationship and (d) temporal variation in volume waveforms over a cardiac loop from one representative animal (Pig 2). Baseline simulation case (black line); experimental measurement (black dots); acute overload simulation case (red line). Note that there are no corresponding measurements for the acute overload simulation case (i.e., immediately after induction of pressure overload).