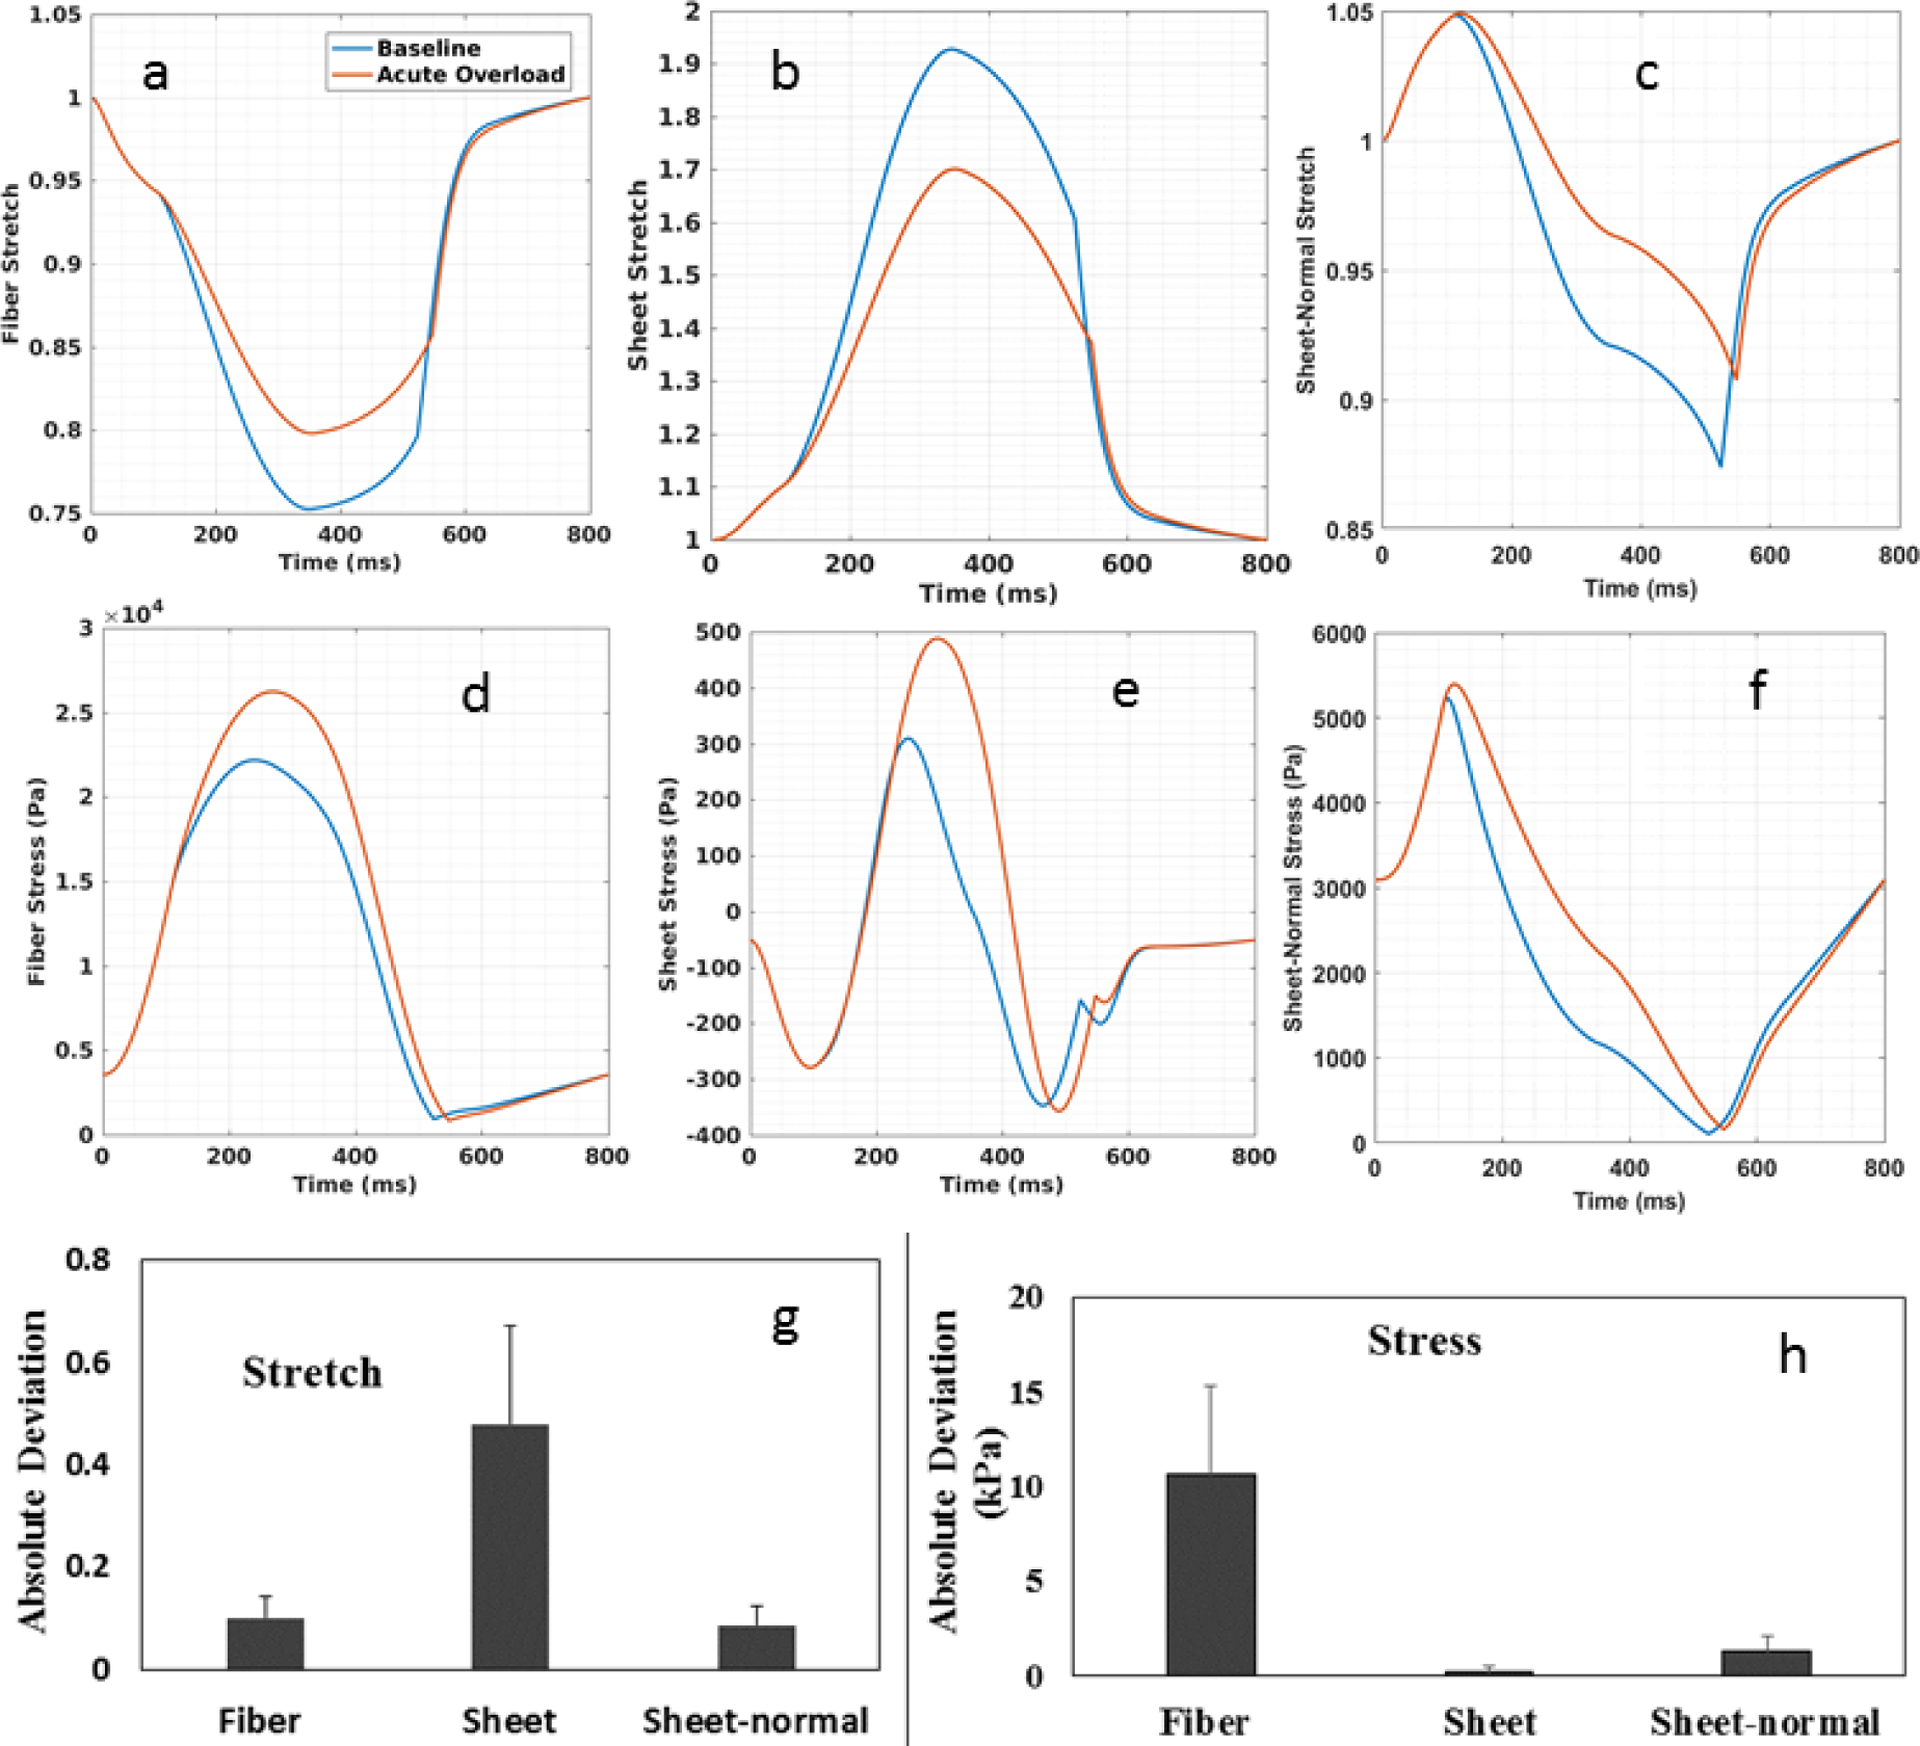
Figure 4:

Comparison of normal stress and stretch in the fiber, sheet and sheet-normal directions between the baseline and acute overload cases. Spatially averaged waveforms of the baseline (blue) and acute overload (red) for: (a) fiber stretch (b) sheet stretch (c) sheet-normal stretch (d) fiber stress (e) sheet stress and (g) sheet-normal stress. Stretch was computed with end-diastolic configuration as reference. Maximum absolute deviation of (g) stretch and (h) stress averaged over four pigs. Maximum absolute deviation is defined to be the absolute maximum difference between quantities obtained in the acute overload and baseline case averaged over all material points and averaged for 4 pigs.
