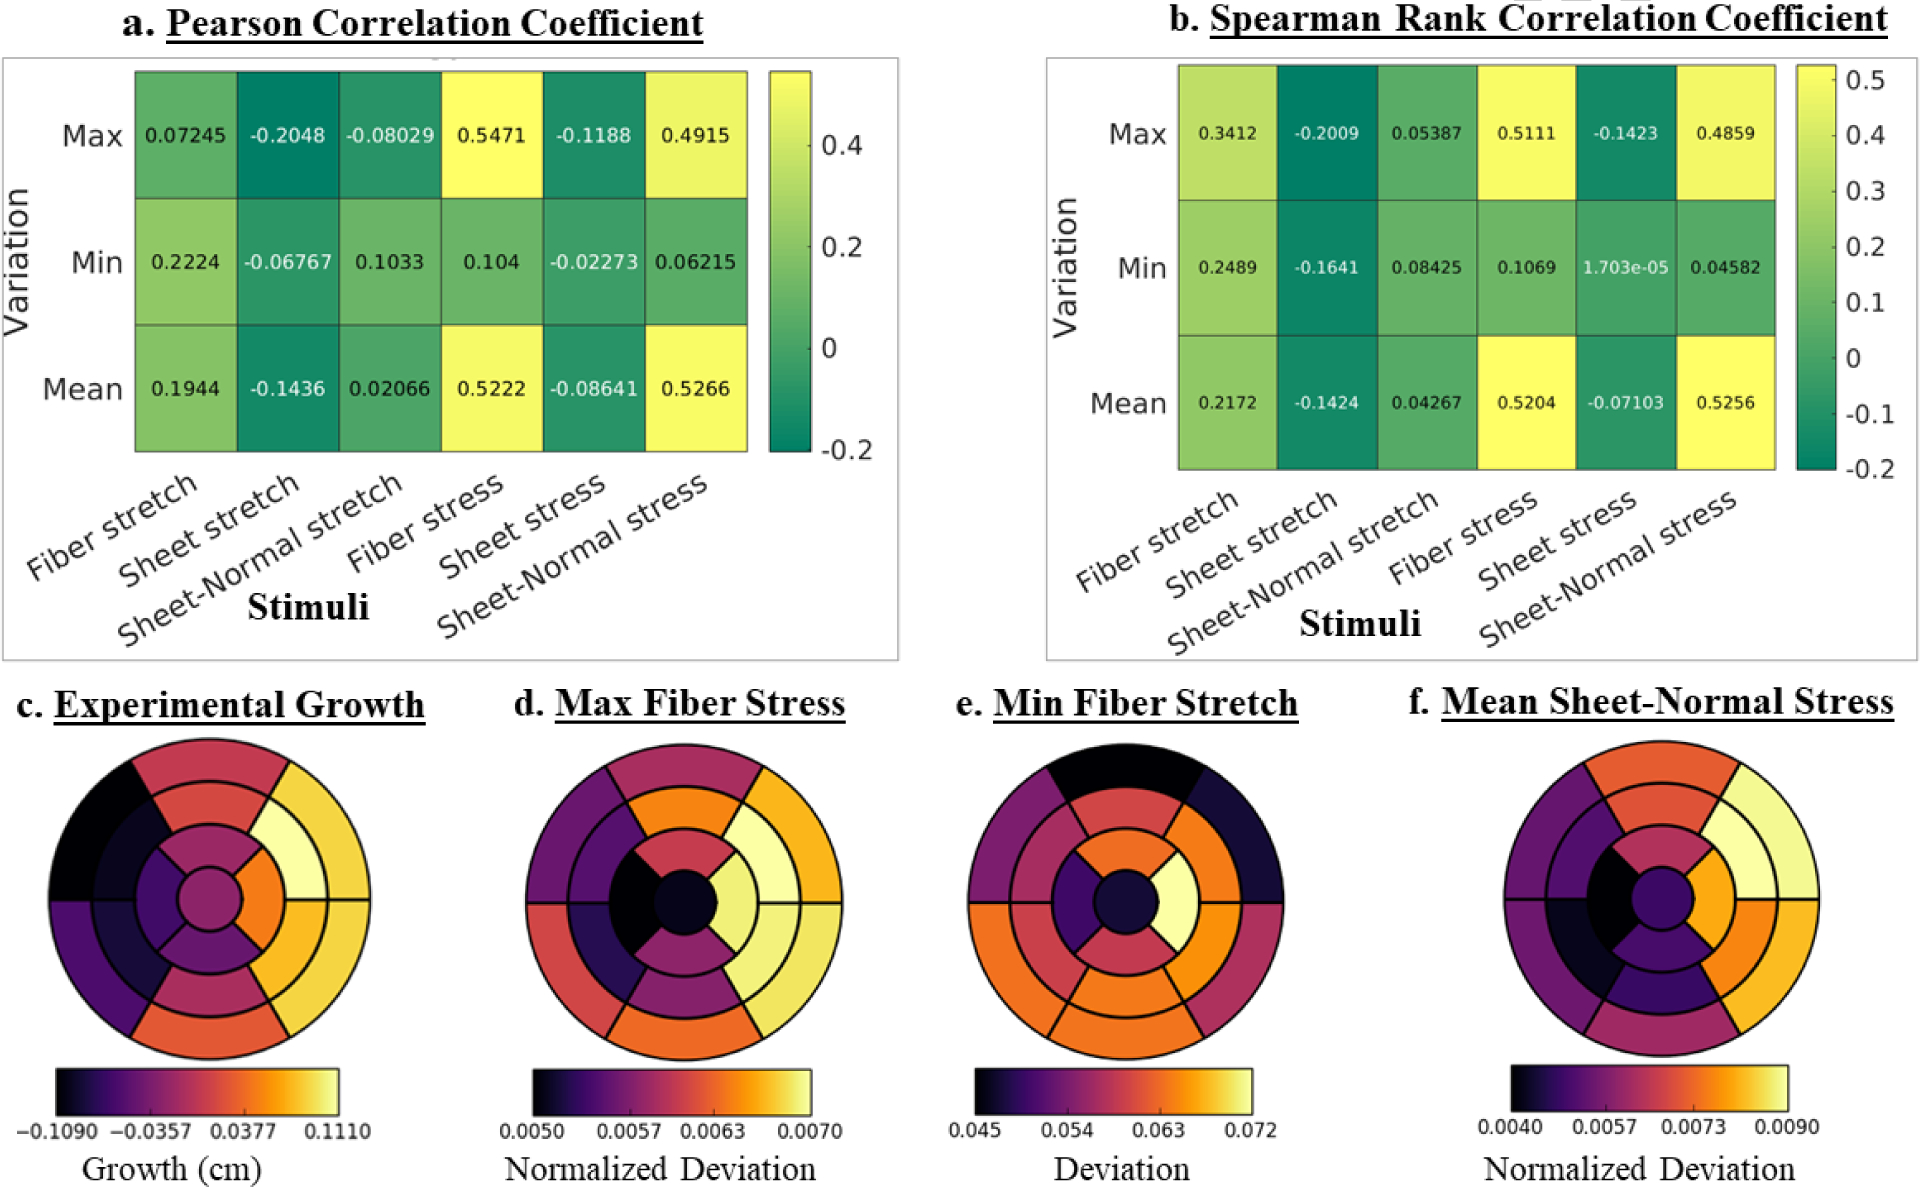
Figure 5: (a).

(a) Pearson, (b) Spearman rank correlation coefficients of growth with changes in maximum, minimum and mean stress and stretch over a cardiac cycle. (c) Regional growth measured experimentally. (d) – (f): Regional changes (arithmetic differences between acute overload and baseline cases) of the maximum fiber stress, minimum fiber stretch and mean sheet-normal stress. Quantities are averaged over 4 pigs. Regional changes in maximum fiber stress and mean sheet-normal stress are normalized by their corresponding magnitude from baseline.
