
Figure 6.
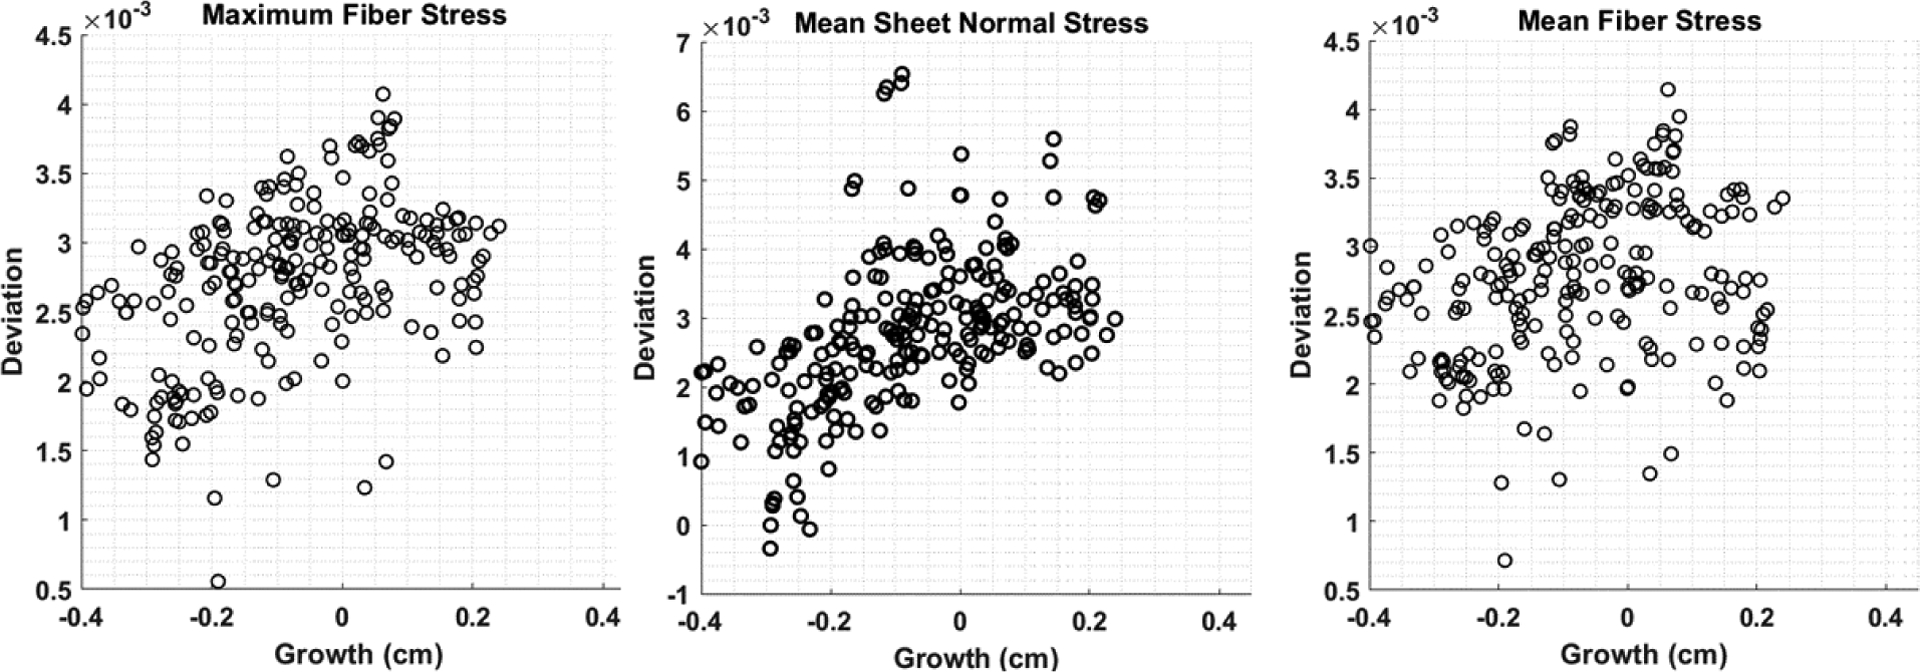
Scatter plots of the local growth with changes in stimuli in the LV of a representative case (pig 1). These three stimuli show best correlation with growth (see Figure 5a). Deviation of each stimulus (which correspond to a feature of the time-varying waveform over a cardiac cycle i.e., maximum and mean at a material point) is defined by its arithmetic differences between the acute overload and baseline cases.