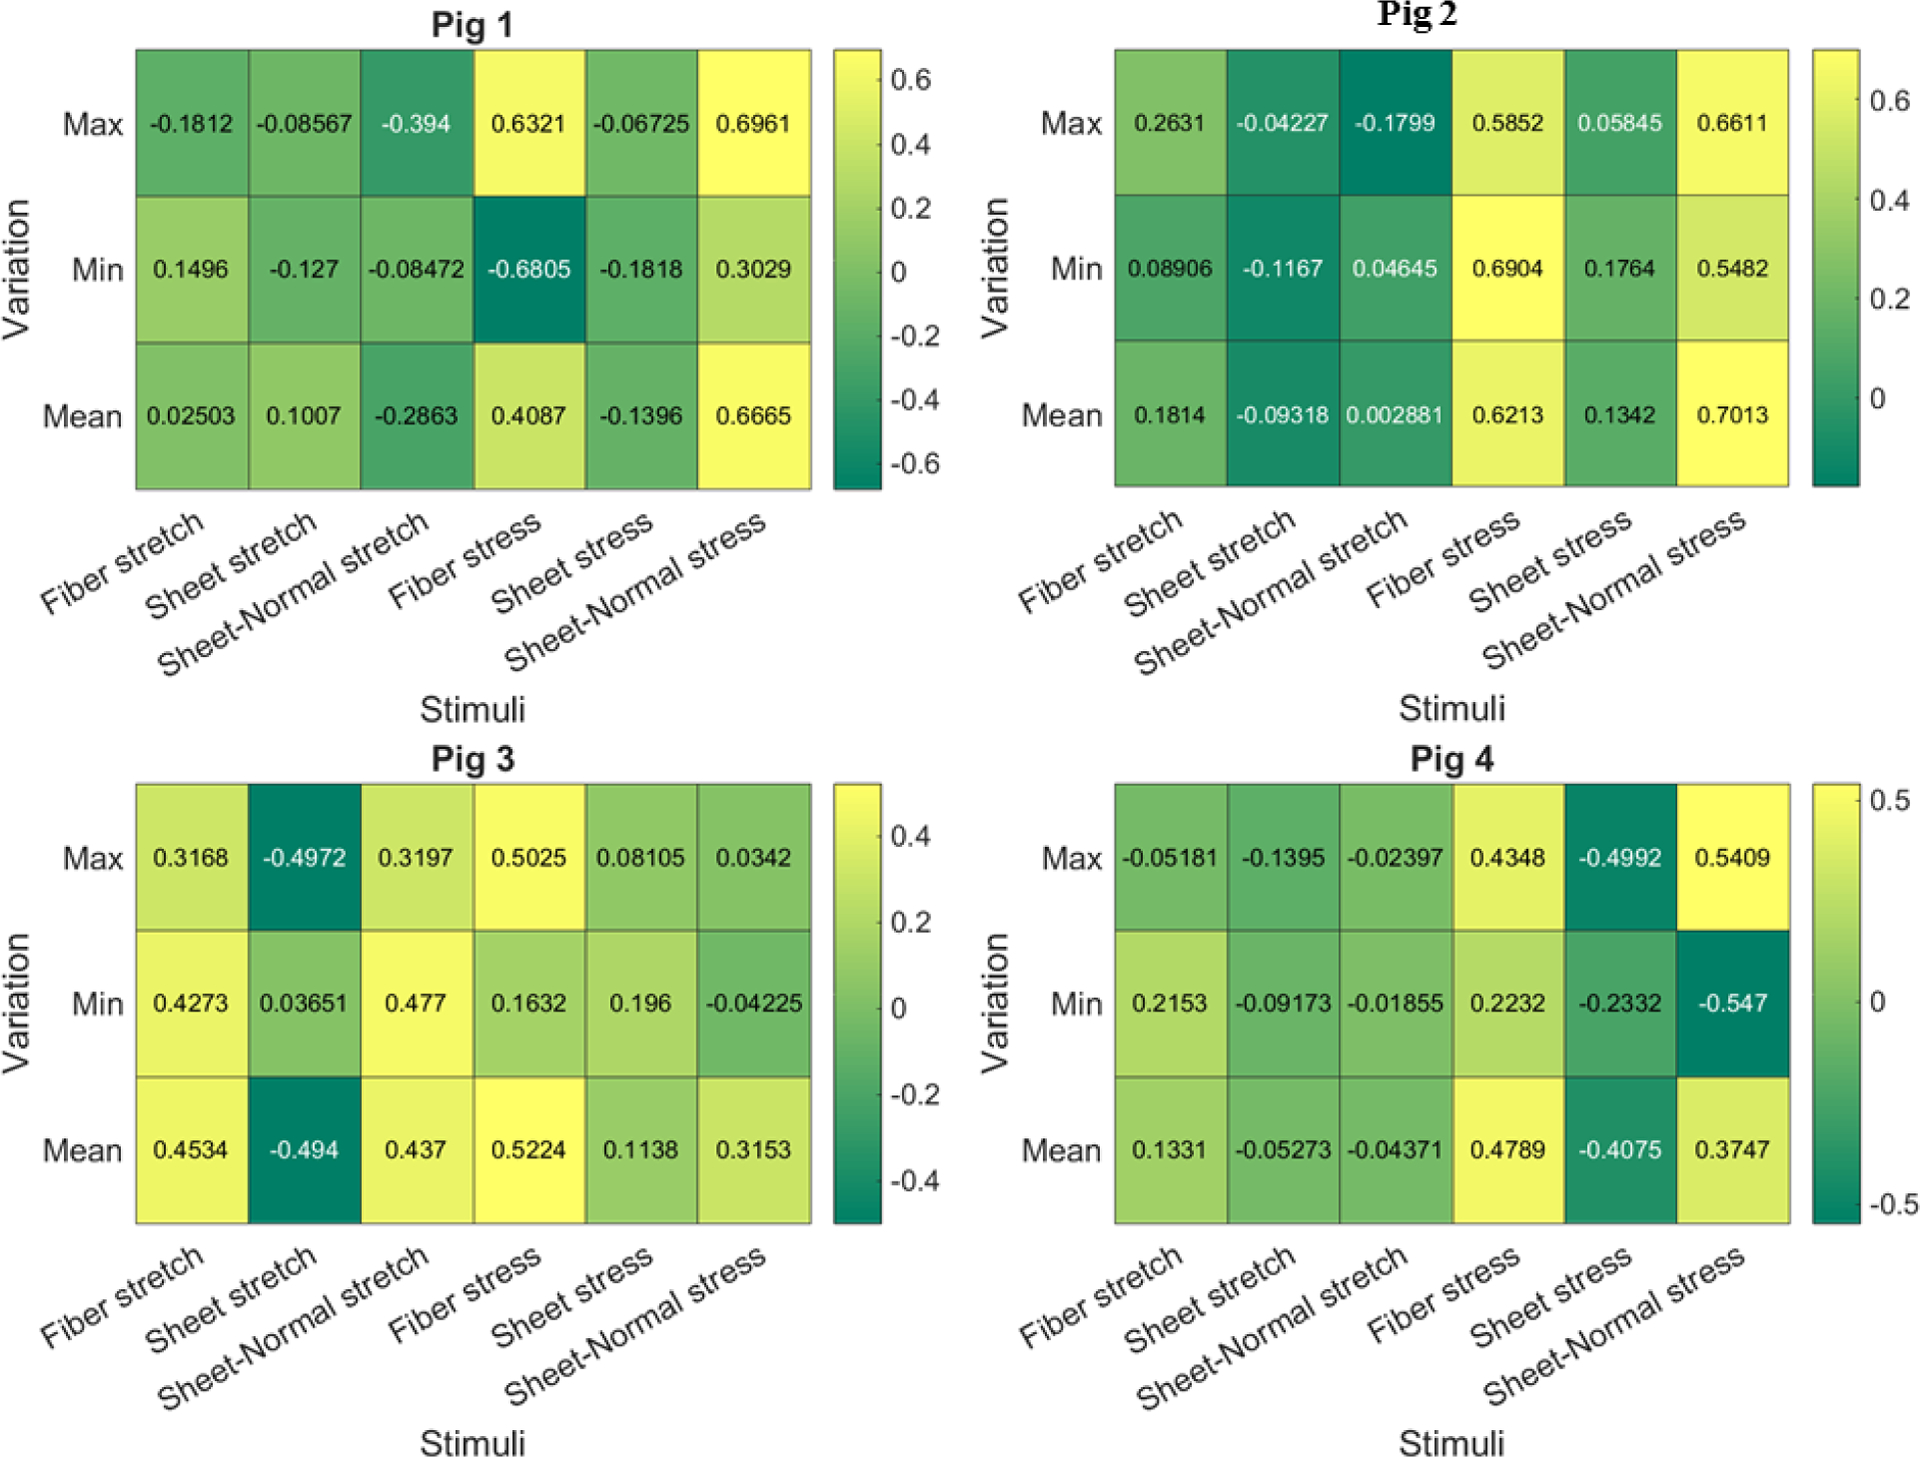
Figure 9:

Pearson correlation coefficient of the 18 mechanical stimuli with growth for the 4 pig models. Value close to +1 or −1 indicates strong positive and negative correlation, respectively. Value close to 0 indicates no correlation.

Pearson correlation coefficient of the 18 mechanical stimuli with growth for the 4 pig models. Value close to +1 or −1 indicates strong positive and negative correlation, respectively. Value close to 0 indicates no correlation.