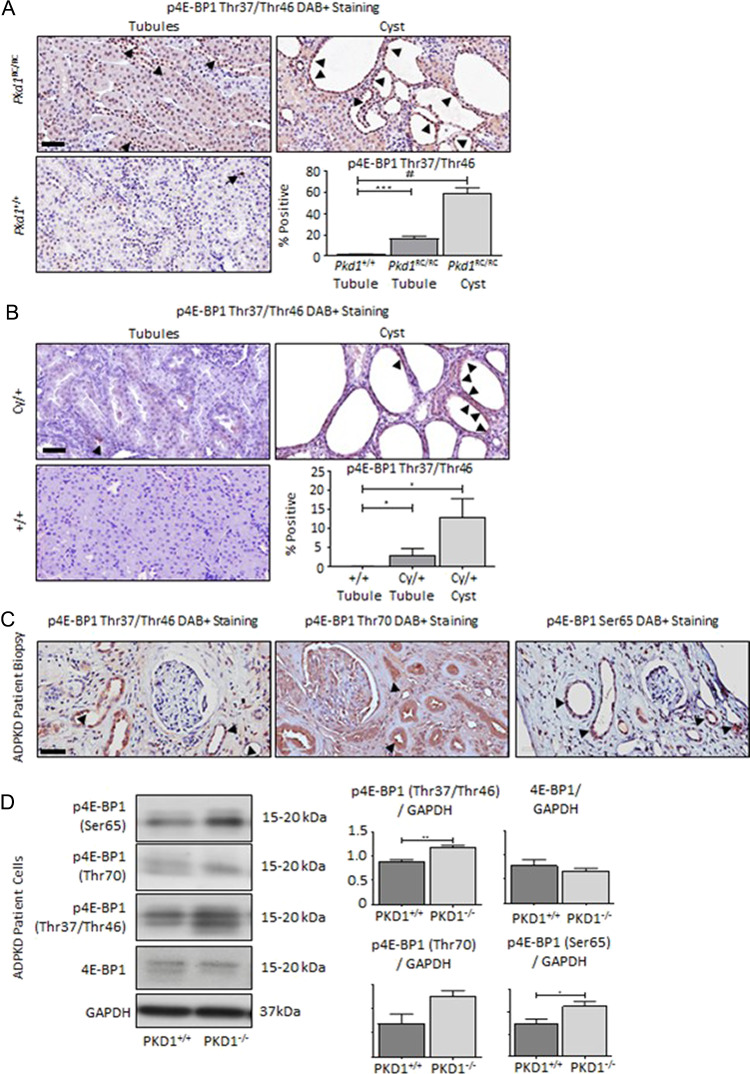
Figure 1.

Increased phosphorylated 4E-BP1 in PKD rodent and patient tissues. (A) Pkd1RC/RC mice and (B) Cy/+ rats relative to age-matched strain controls (+/+) demonstrated increased p4E-BP1 (Thr37/46) in non-cystic tubules and stained positively in cells lining cysts. (C) End-stage renal biopsies indicated DAB positivity for p4E-BP1 (Thr37/Thr46, Thr70 and Ser65) by immunohistochemistry. Quantification is expressed as percent of cells staining positive per 100-μm2 area. Black arrows indicate DAB+ staining. Scale bar = 50 μm (D) PKD1−/− cells exhibit increased expression of p4E-BP1 (Thr37/Thr46, Thr70 and Ser65) in contrast to the PKD1+/+ renal epithelial cell line. Total 4E-BP1 was not different between groups. RDU, relative densitometry units. N = 4–5 per group. Multiple-group comparisons are performed using analysis of variance (ANOVA) with posttest according to Newman–Keuls. Single comparisons were made using Student’s T test. A P value of < 0.05 was considered statistically significant. Values are expressed as the mean ± SEM. *P < 0.05, **P < 0.01, ***P < 0.001, #P < 0.0001.
