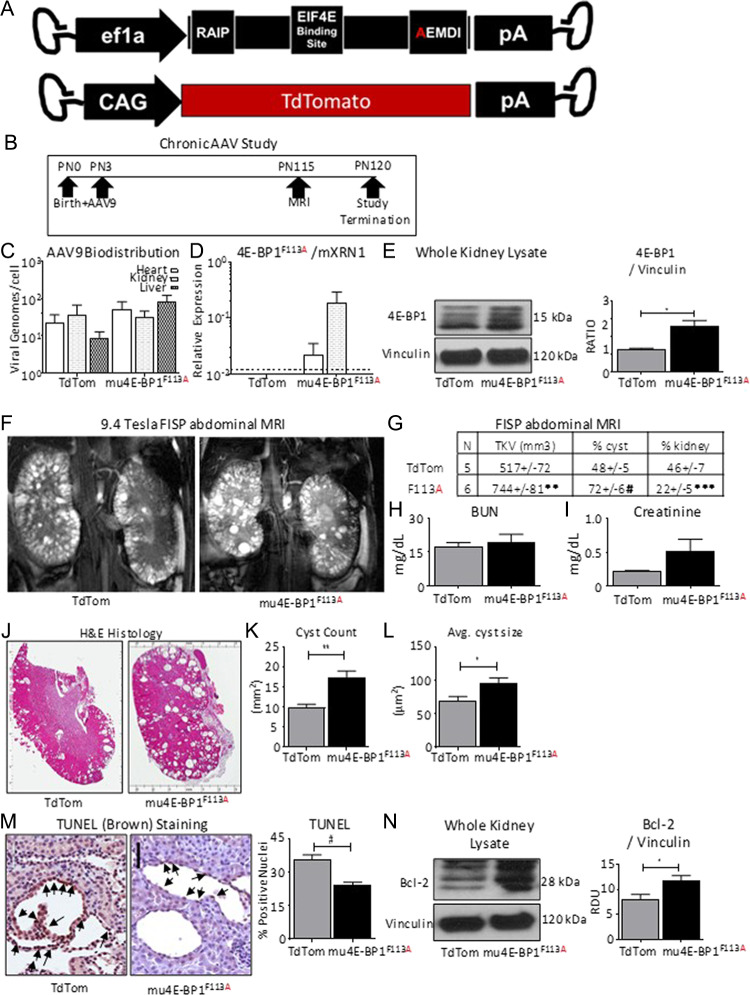
Figure 3.

Chronic exposure to 4E-BP1 FEMDI mutant increases cyst burden in vivo. (A) Diagrams of AAV9-4E-BP1F113A (F113A, N = 6) and AAV9-TdTomato (TdTom, N = 5). (B) Study schematic. (C) AAV biodistribution in whole heart, kidney and liver homogenates. (D) Quantification of 4E-BP1F113A expression in whole heart, kidney and liver homogenates. (E) Quantification and representative immunoblot of total 4E-BP1 and loading control vinculin protein levels in whole kidney homogenates. (F) Representative FISP abdominal MRIs of 4E-BP1F113A and TdTom treated Pkd1RC/RC. (G) Quantification of total kidney volume (TKV), % of the kidney determined to be cystic by MRI (% cyst) or functional by MRI (% kidney). (H) Blood urea nitrogen (BUN), and (I) serum creatinine measurements of 4E-BP1F113A (F113A, N = 6) and TdTomato (TdTom, N = 5) treated mice. (J) Representative hematoxylin & eosin (H&E) stained sections and (K) cystic indices quantified, such as Cyst count, and (L) average cyst size. (M) Immunohistochemistry staining of apoptosis marker, TUNEL, quantification specific to cells lining the cysts, and (N) immunoblotting of anti-apoptotic marker, Bcl-2, in whole kidney homogenates of treated and control Pkd1RC/RC kidneys. Quantification of TUNEL is expressed as percent of nuclei staining positive per cyst. Black arrows indicate DAB+ staining. Scale bar = 50 μm. Single comparisons were made using Student’s T test. Values are expressed as the mean ± SEM. *P < 0.05, **P < 0.01, ***P < 0.001, #P < 0.0001.
