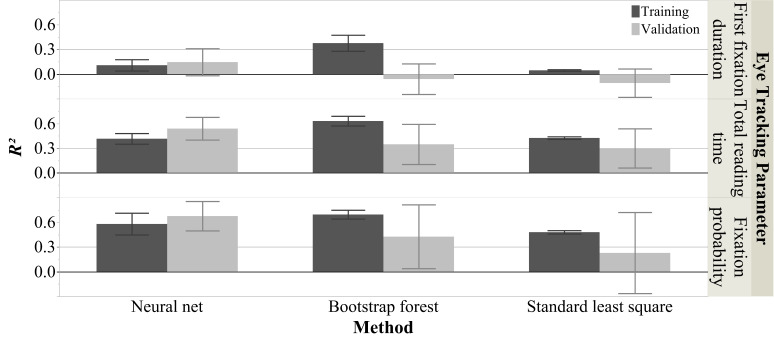
Figure 2.
Model Fits of Different Measure Groups via Different Modeling Methods. This figure shows the mean R2s from 1000 iterations for three eye tracking parameters for both the training and validation sets using all three modeling approaches. Each error bar is constructed using 1 standard deviation from the mean.

