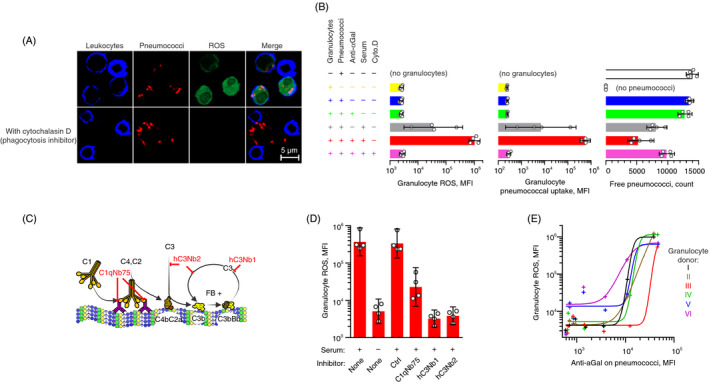
FIGURE 6.

Polyreactive anti‐αGal antibodies drive phagocytosis of serotype 9V pneumococci in a complement‐dependent manner. Fluorescently labelled serotype 9V pneumococci were opsonized in 10% human hypogammaglobulinaemia serum (‘serum’) supplemented with anti‐αGal at 20 mg/L (unless otherwise is stated) before feeding to plasma‐depleted human blood cells labelled with dihydrorhodamine‐123. Dihydrorhodamine‐123 (non‐fluorescent) is oxidized to rhodamine‐123 (fluorescent) by intra‐phagosomal reactive oxygen species (ROS) produced in phagocytosing granulocytes. Confocal microscopy in A and flow cytometry data in B, D and E. (A) Experiments with and without the phagocytosis inhibitor cytochalasin D. The panel shows that pneumococci and ROS were inside the leucocytes when the phagocytosis inhibitor was omitted, whereas no ROS or pneumococci were inside the leucocytes when the phagocytosis inhibitor was present. (B) Effect of constituents in the experiments on granulocyte ROS (left), pneumococcal uptake (centre) and clearance of free pneumococci from the supernatant (right). Bars represent mean with 95% confidence intervals for different leucocyte donors (n = 4). (C) Illustration of complement activation by IgG antibodies bound on antigen and the points of action for the specific complement inhibitors used in the experiments shown in the following panel. ‘C1qNb75’, blocks C1q binding to immunoglobulin; ‘hC3Nb1’, blocks C3 cleavage by alternative pathway; and ‘hC3Nb2’, blocks C3 cleavage by classical and alternative pathways. (D) Granulocyte ROS induced by pneumococci, opsonized with anti‐αGal at 5 mg/L in the presence of inhibitors of selective complement factors. ‘Ctrl’, nanobody of irrelevant specificity. Mean with 95% confidence intervals for different leucocyte donors (n = 4). (E) Granulocyte ROS as function of the density of anti‐αGal on opsonized pneumococci. For each of six leucocyte donors, experiments were performed with the following concentrations of anti‐αGal: 0, 0·020, 0·078, 0·31, 1·3, 5 and 20 mg/L. Curves were fitted in sigmoid models (R 2 ≥ 0·92)
