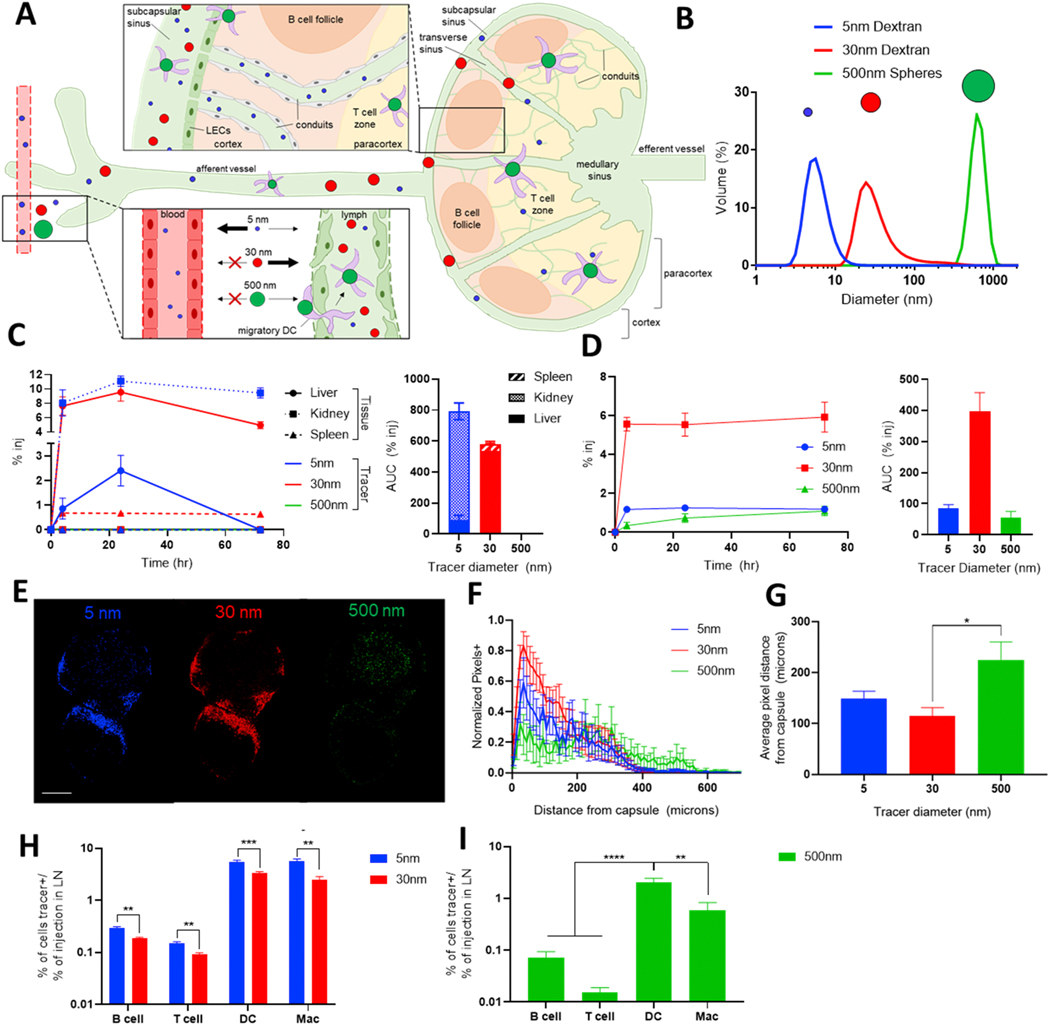
Figure 2. Lymphatic transport is regulated by molecule size, and a tracer panel can probe this differential transport.
A) Schematic of size-based effects on molecule drainage from the interstitium and into draining LNs (dLNs). Blue = 5 nm, red = 30 nm, and green = 500 nm molecules. B) Diameter of selected fluorescent tracers as measured by dynamic light scattering. C) Time course of tracer biodistribution in systemic organs based on their size (left), and their total accumulation in each organ (right). Tracers are cleared from systemic circulation according to their size, with 5 nm clearance in the kidney and 30 nm clearance by the liver. D) Timecourse of tracer appearance in the dLN based on their size (left) and total accumulation, measured by area under the curve (right). 30 nm tracers reach the LN more efficiently than 5 or 500 nm tracers. Passively draining tracers show significant signal in the dLN within 4 h, while 500 nm tracers show a more gradual appearance in the dLN. E) Confocal microscopy images of tracer distribution within a brachial LN 72 h after ipsilateral forelimb injection. Scale bar = 500 μm. F) Quantified distribution of tracer+ pixels in axillary and brachial LN draining forelimb injections. 30 nm tracers show a more peripheral bias than lower accumulating 5 nm tracer. Beyond 400 μm from the LN capsule, 500 nm signal is greater than that of passively draining tracers. G) Average tracer penetration depth. H) 5 nm tracers have improved access to LN cells compared to larger 30 nm tracers. I) Actively transported 500 nm tracers tend to appear preferentially in DCs. In G and I, broad cell types are defined as follows: B cell (B220+CD3-CD11b-), T cell (CD3+B220-), DC (CD11c+), macrophage (F4/80+).

