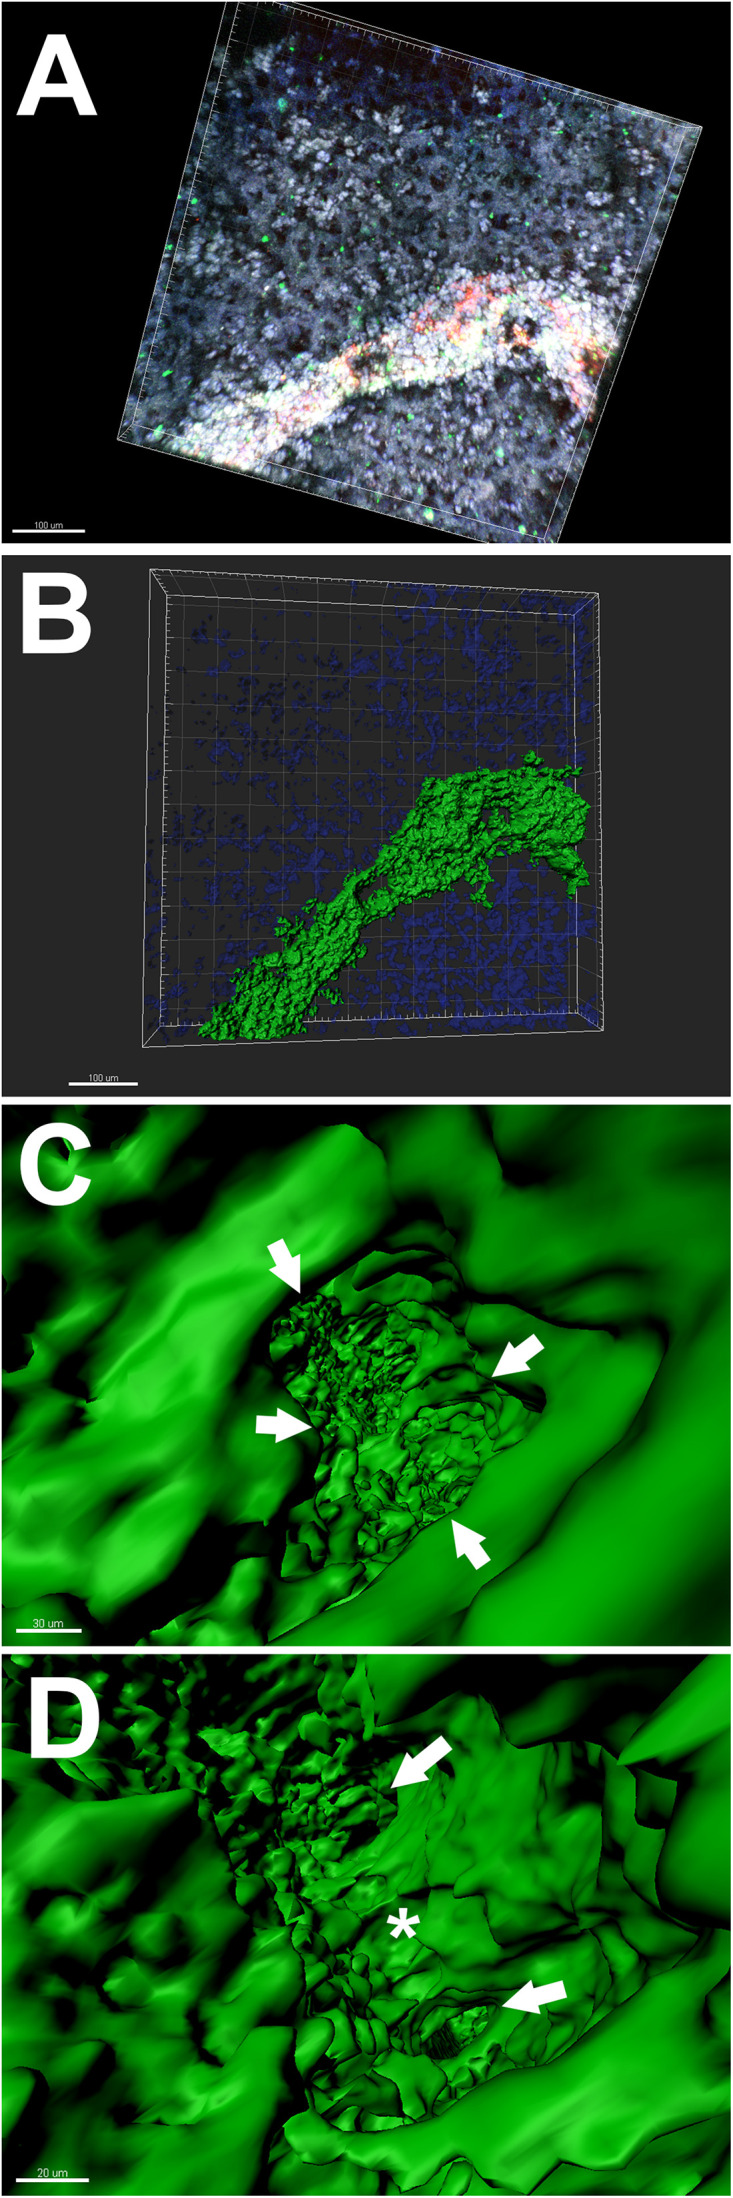
FIGURE 6.

Lumen evaluation of CD31+ endothelial cells within a 3D bioprinted patch generated with alginate 4%/gelatin 8% hydrogel. (A–D) 3D rendering analysis using Imaris software of a 3D bioprinted patch stained with antibodies against CD31 (green) and Hoechst stain (blue). (A) and (B) 3D rendering of the endothelial structure shown previously (in Figure 5). Scale bars 100 μm. (C) and (D) Higher magnification images depicting the inside of the structural lumen formed by endothelial cells within a 3D bioprinted patch. (C) Arrows indicate the inner (luminal) surface of the walls (green). Scale bar 30 μm. (D) The star indicates a pillar joining two opposing endothelial surfaces where the lumen branches into two smaller lumens (arrows). Scale bar 20 μm. For a full view of the 3D rendering analysis of the same lumen formed within the 3D bioprinted patch please see Supplementary Video 2.
