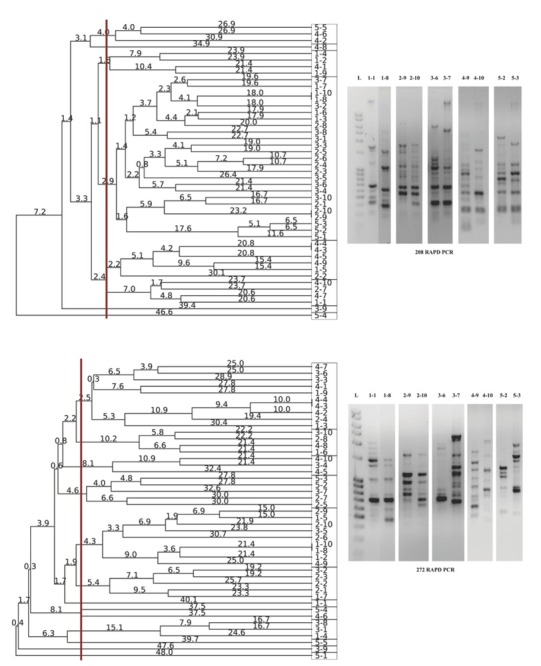
Figure 2.

Dendrogram obtained by UPGMA analysis of the selected Pseudomonas isolates using 208 (top) and 272 (bottom) primers, based on RADP profile (right). Genetic distances were presented with numbers placed on the branches. Rectangles are representing the isolate grouping according to obtained RAPD patterns
