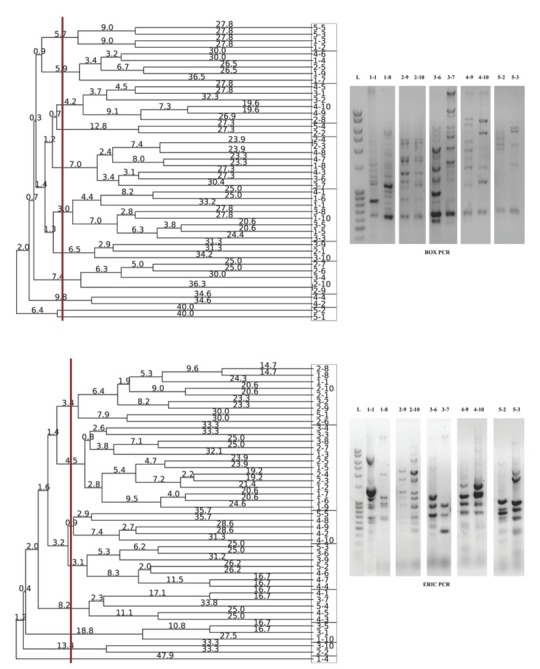
Figure 3.

Dendrogram obtained by UPGMA analysis of the selected Pseudomonas isolates using BOX (top) and ERIC (bottom) primers, based on rep-PCR profile (right). Genetic distances were presented with numbers placed on the branches. Rectangles are representing the isolate grouping according to obtained rep-PCR patterns
