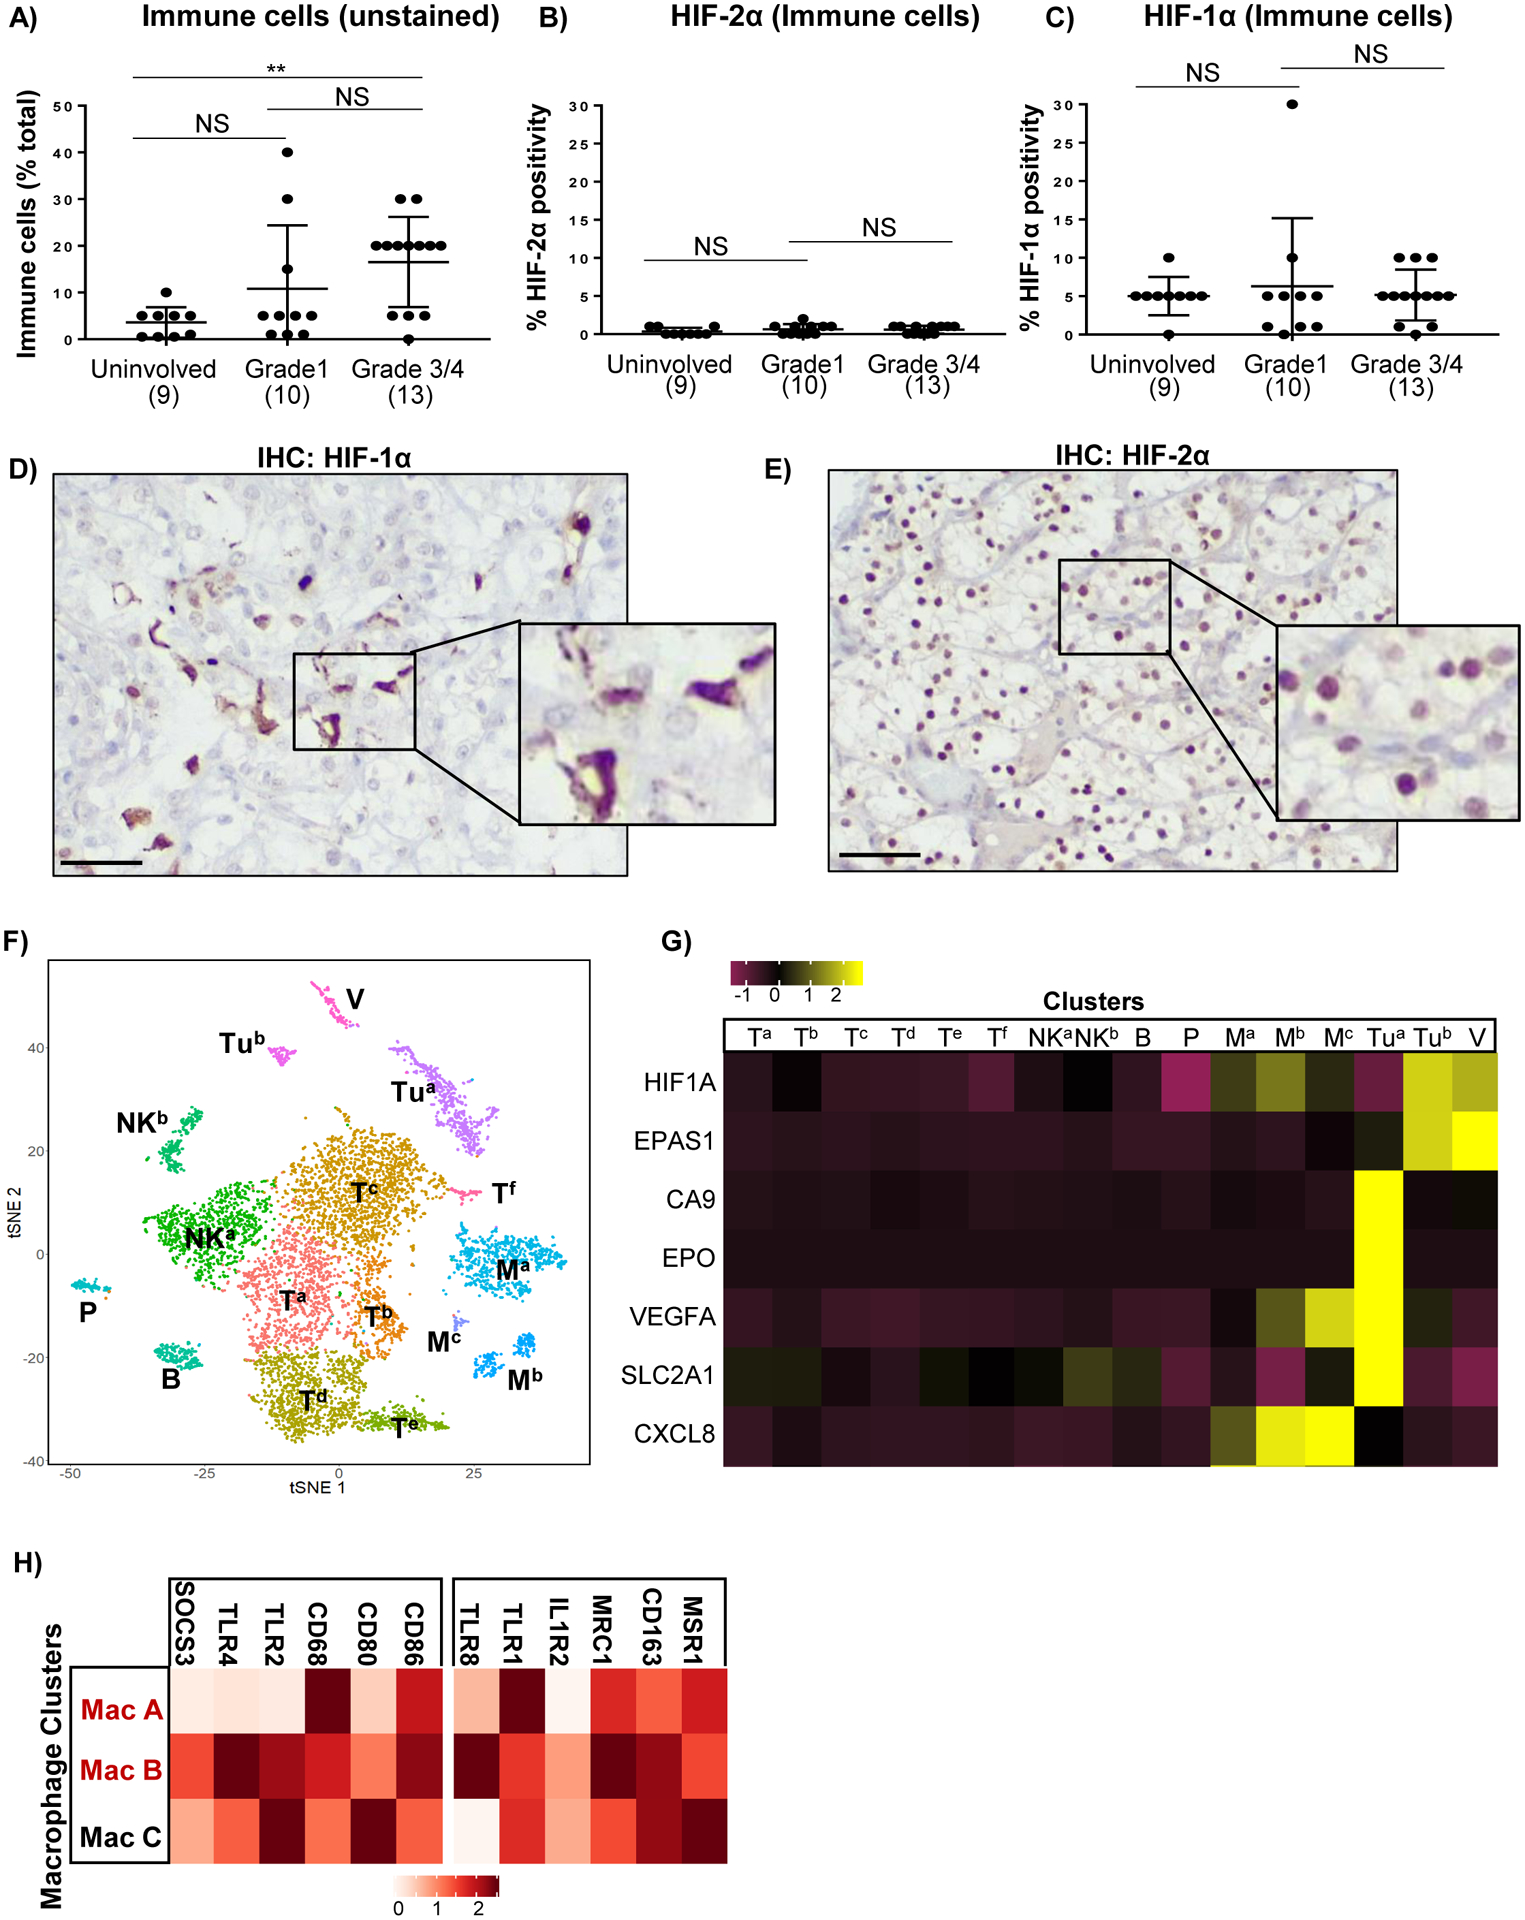
Figure 3: HIF-1α is primarily expressed in tumor-associated macrophages (TAMs).

A) Percent of immune cells as a percentage of total cells in tumors as determined by pathologists’ analysis of hematoxylin and eosin (H&E) stained tissue sections. B,C) Percent of immune cells that stained positive for HIF-2α (B) or HIF-1α (C) as determined by pathologists’ analysis of HIF-1/2α stained sections with reference to H&E stained sections. Each dot on the plots indicates a single patient with patient numbers indicated in brackets. D-E) IHC showing HIF-1α (D) and HIF-2α (E) localization in matched high grade ccRCC. Scale bars = 50μM. F) T-SNE plots showing clustering of indicated cell types from single cell sequencing of ccRCC tissue from 3 patients. V = vasculature; Tu = tumor cells; T = T-cells, NK = NK cells, P = plasma cells, B = B-cells; M = macrophages. G) Heatmap showing average transcript expression levels for HIF-1α (HIF1A), HIF2-α (EPAS1) and a panel of HIF regulated genes for the indicated cell type clusters. H) Heatmap showing average expression levels of transcripts associated with M1 or M2 polarization in the three macrophage clusters.
