
Figure 4: Characterization of HIF-1α expressing TAMs.
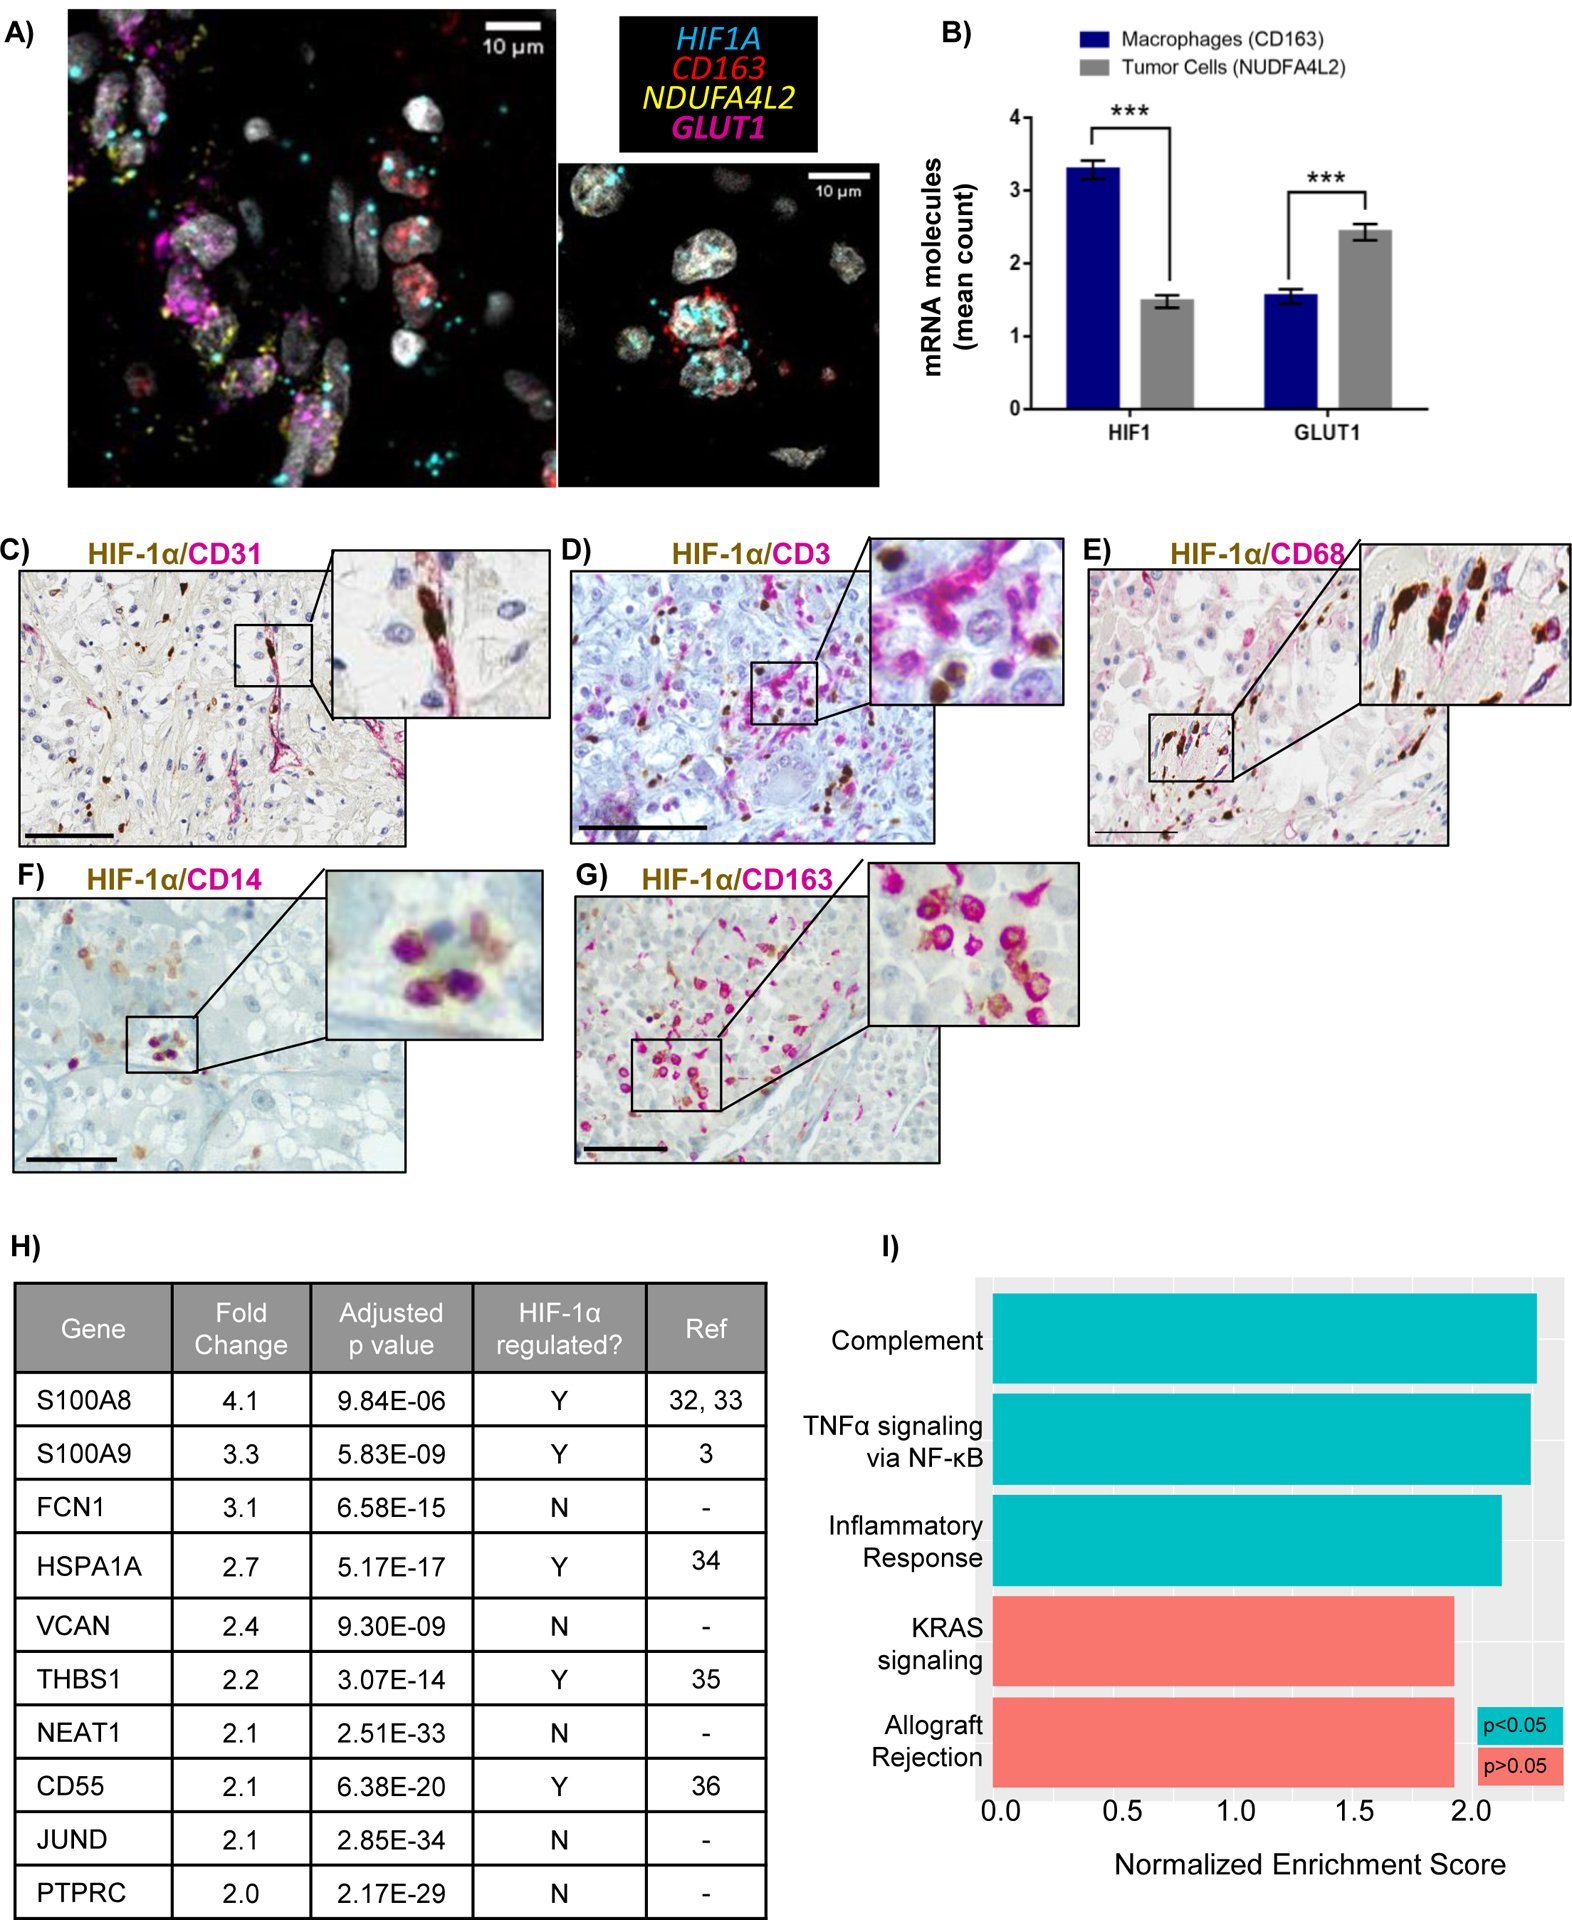
A) RNA in-situ hybridization (RNA-ISH) showing proximity of HIF1A and CD163 in TAMs, and HIF target, GLUT1 (SLC2A1), with ccRCC tumor cell -specific transcript, NDUFA4L2. Scale bars = 10μM. B) Quantitation of average number of HIF1A or GLUT1 mRNA molecules within a 5μM radius of NDUFA4L2 and CD163 molecules. At least 200 NDUFA4L2 and CD163 molecules were assessed across all patients. *** p < 0.0001. C-G) Double staining of HIF-1α with indicated markers. Scale bar = 100μM. H) Top 10 upregulated genes in HIF1A+ macrophages from differential gene expression analysis of HIF1A+ TAMs versus HIF1A− TAMs I) The most positively enriched pathways identified from gene set enrichment analysis on upregulated genes (using a 10% FDR cut-off) in HIF1A+ TAMs.