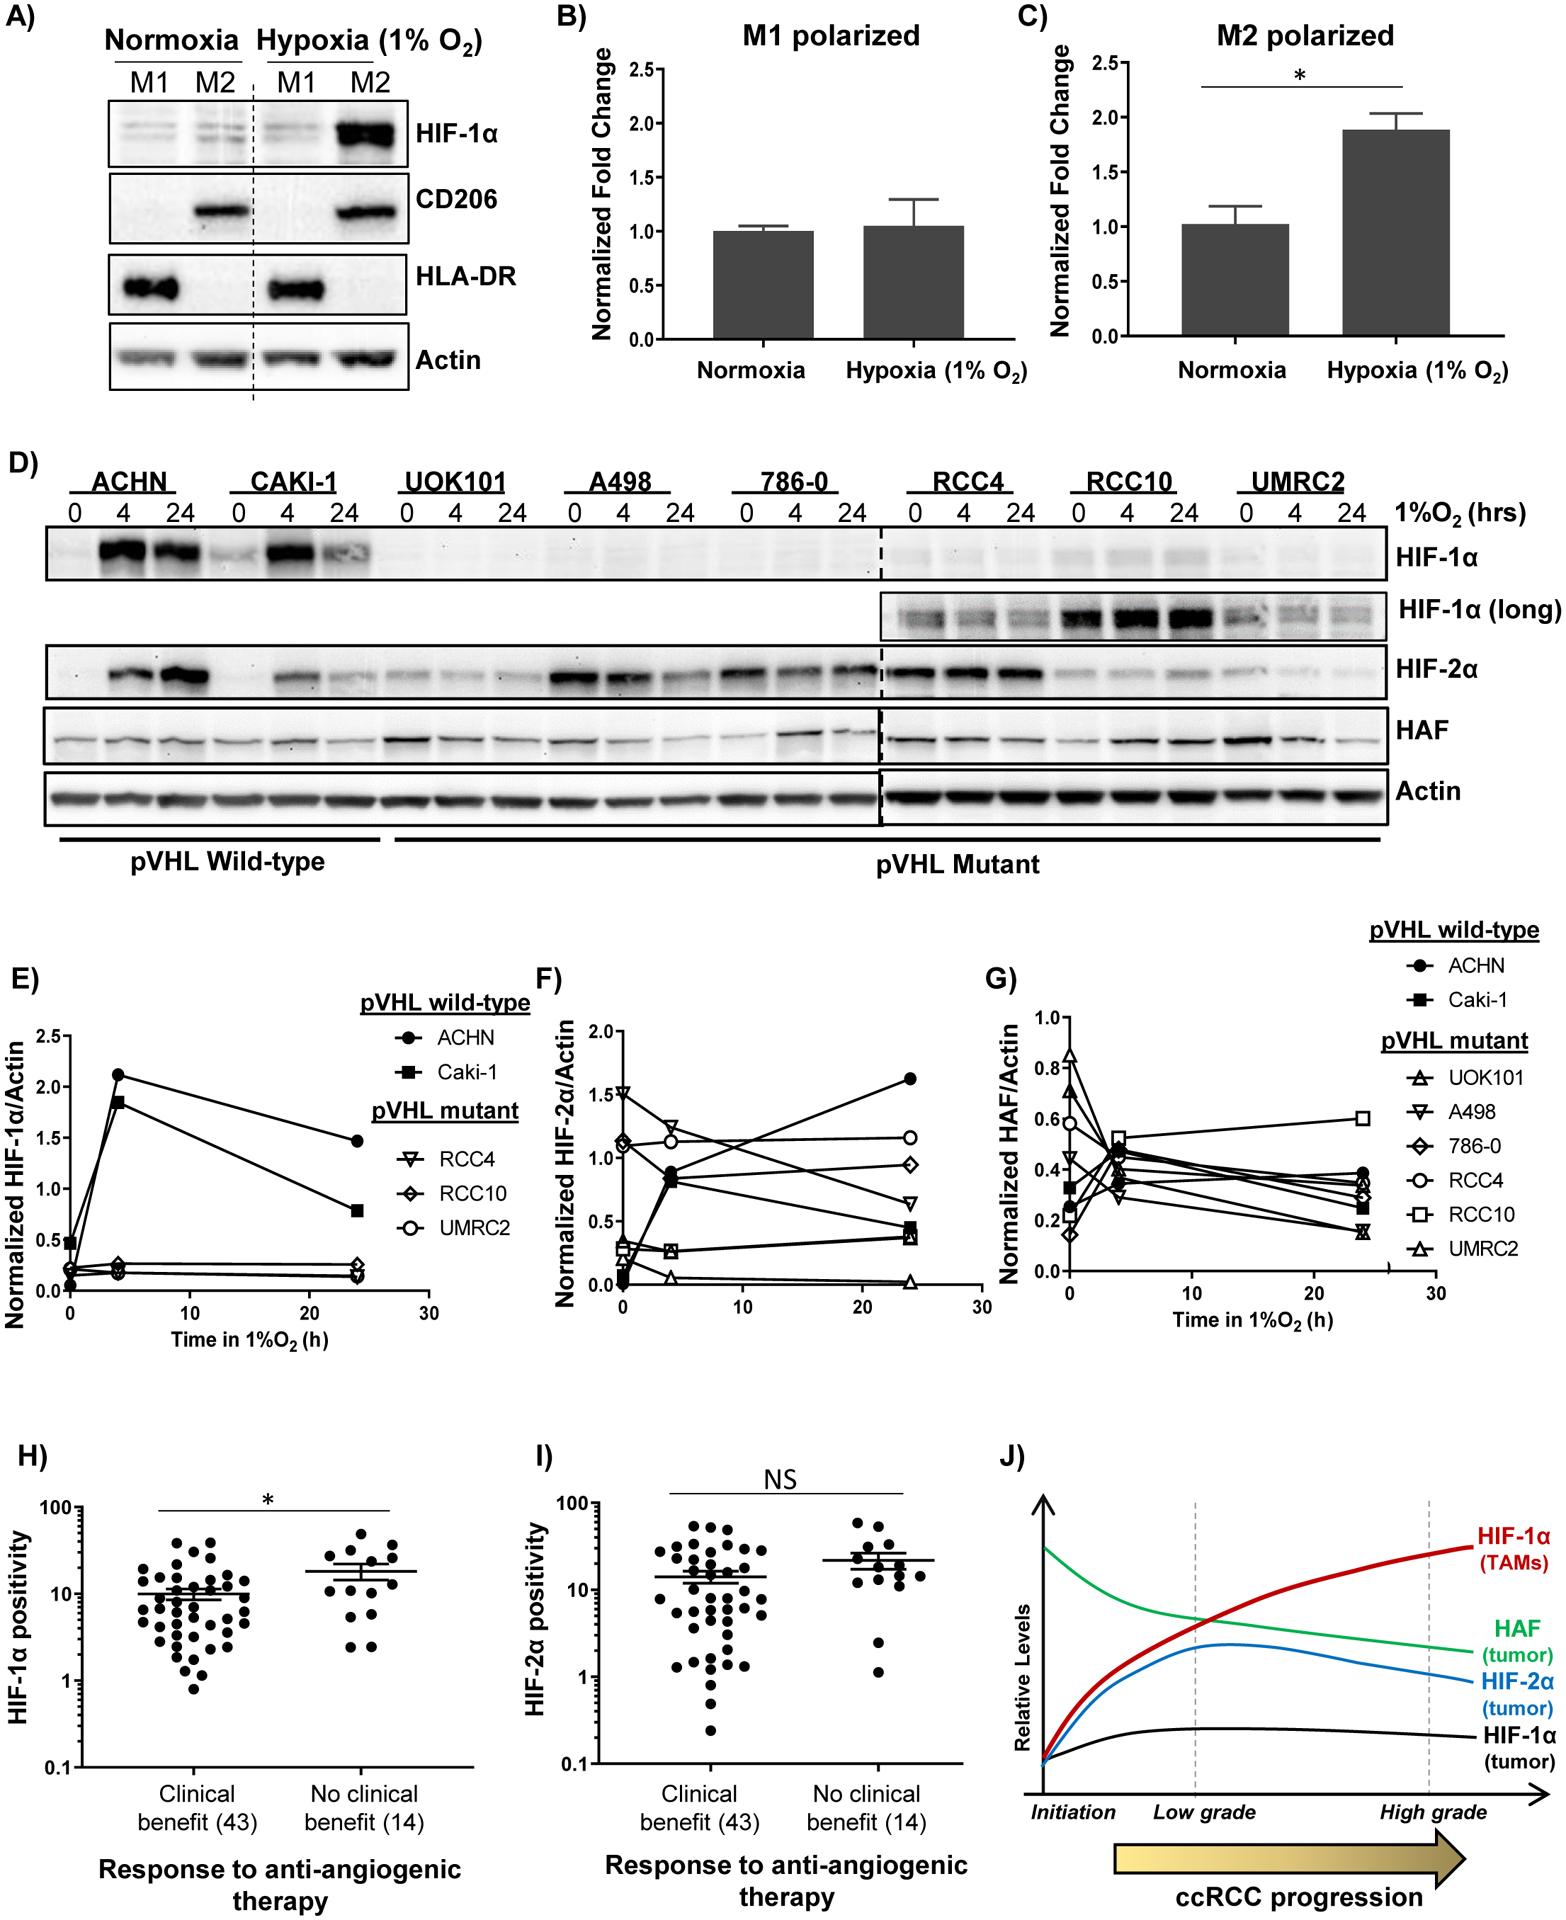
Figure 5: HIF-1α is upregulated in hypoxic M2-polarized macrophages and is associated with resistance to antiangiogenic therapy.

A) Western blots showing effect of exposure of PMA-differentiated THP-1 macrophages to M1 or M2-polarizing cytokines in normoxia or hypoxia. B-C) Taqman-qRT-PCR showing effects of hypoxia on HIF1A normalized to B2M in M1 or M2 polarized macrophages ± SEM. D-G) Western blots showing impact of indicated durations of hypoxia on a panel of RCC cells (D), with quantitation in E-G). H-I) HIF-1α (H) and HIF-2α (I) levels in ccRCC tissue and association with response to angiogenic therapy. *p < 0.05 using unpaired t-tests for log-transformed values. (J) Revised role of HAF and the HIFs in ccRCC: HIF-1α positive TAMs increase with ccRCC progression in the context of HIF-1α loss in tumor cells and is an independent predictor of poor outcome. By contrast, HAF and HIF-2α levels decrease with tumor stage and predict for better outcome.
