
Figure 4.
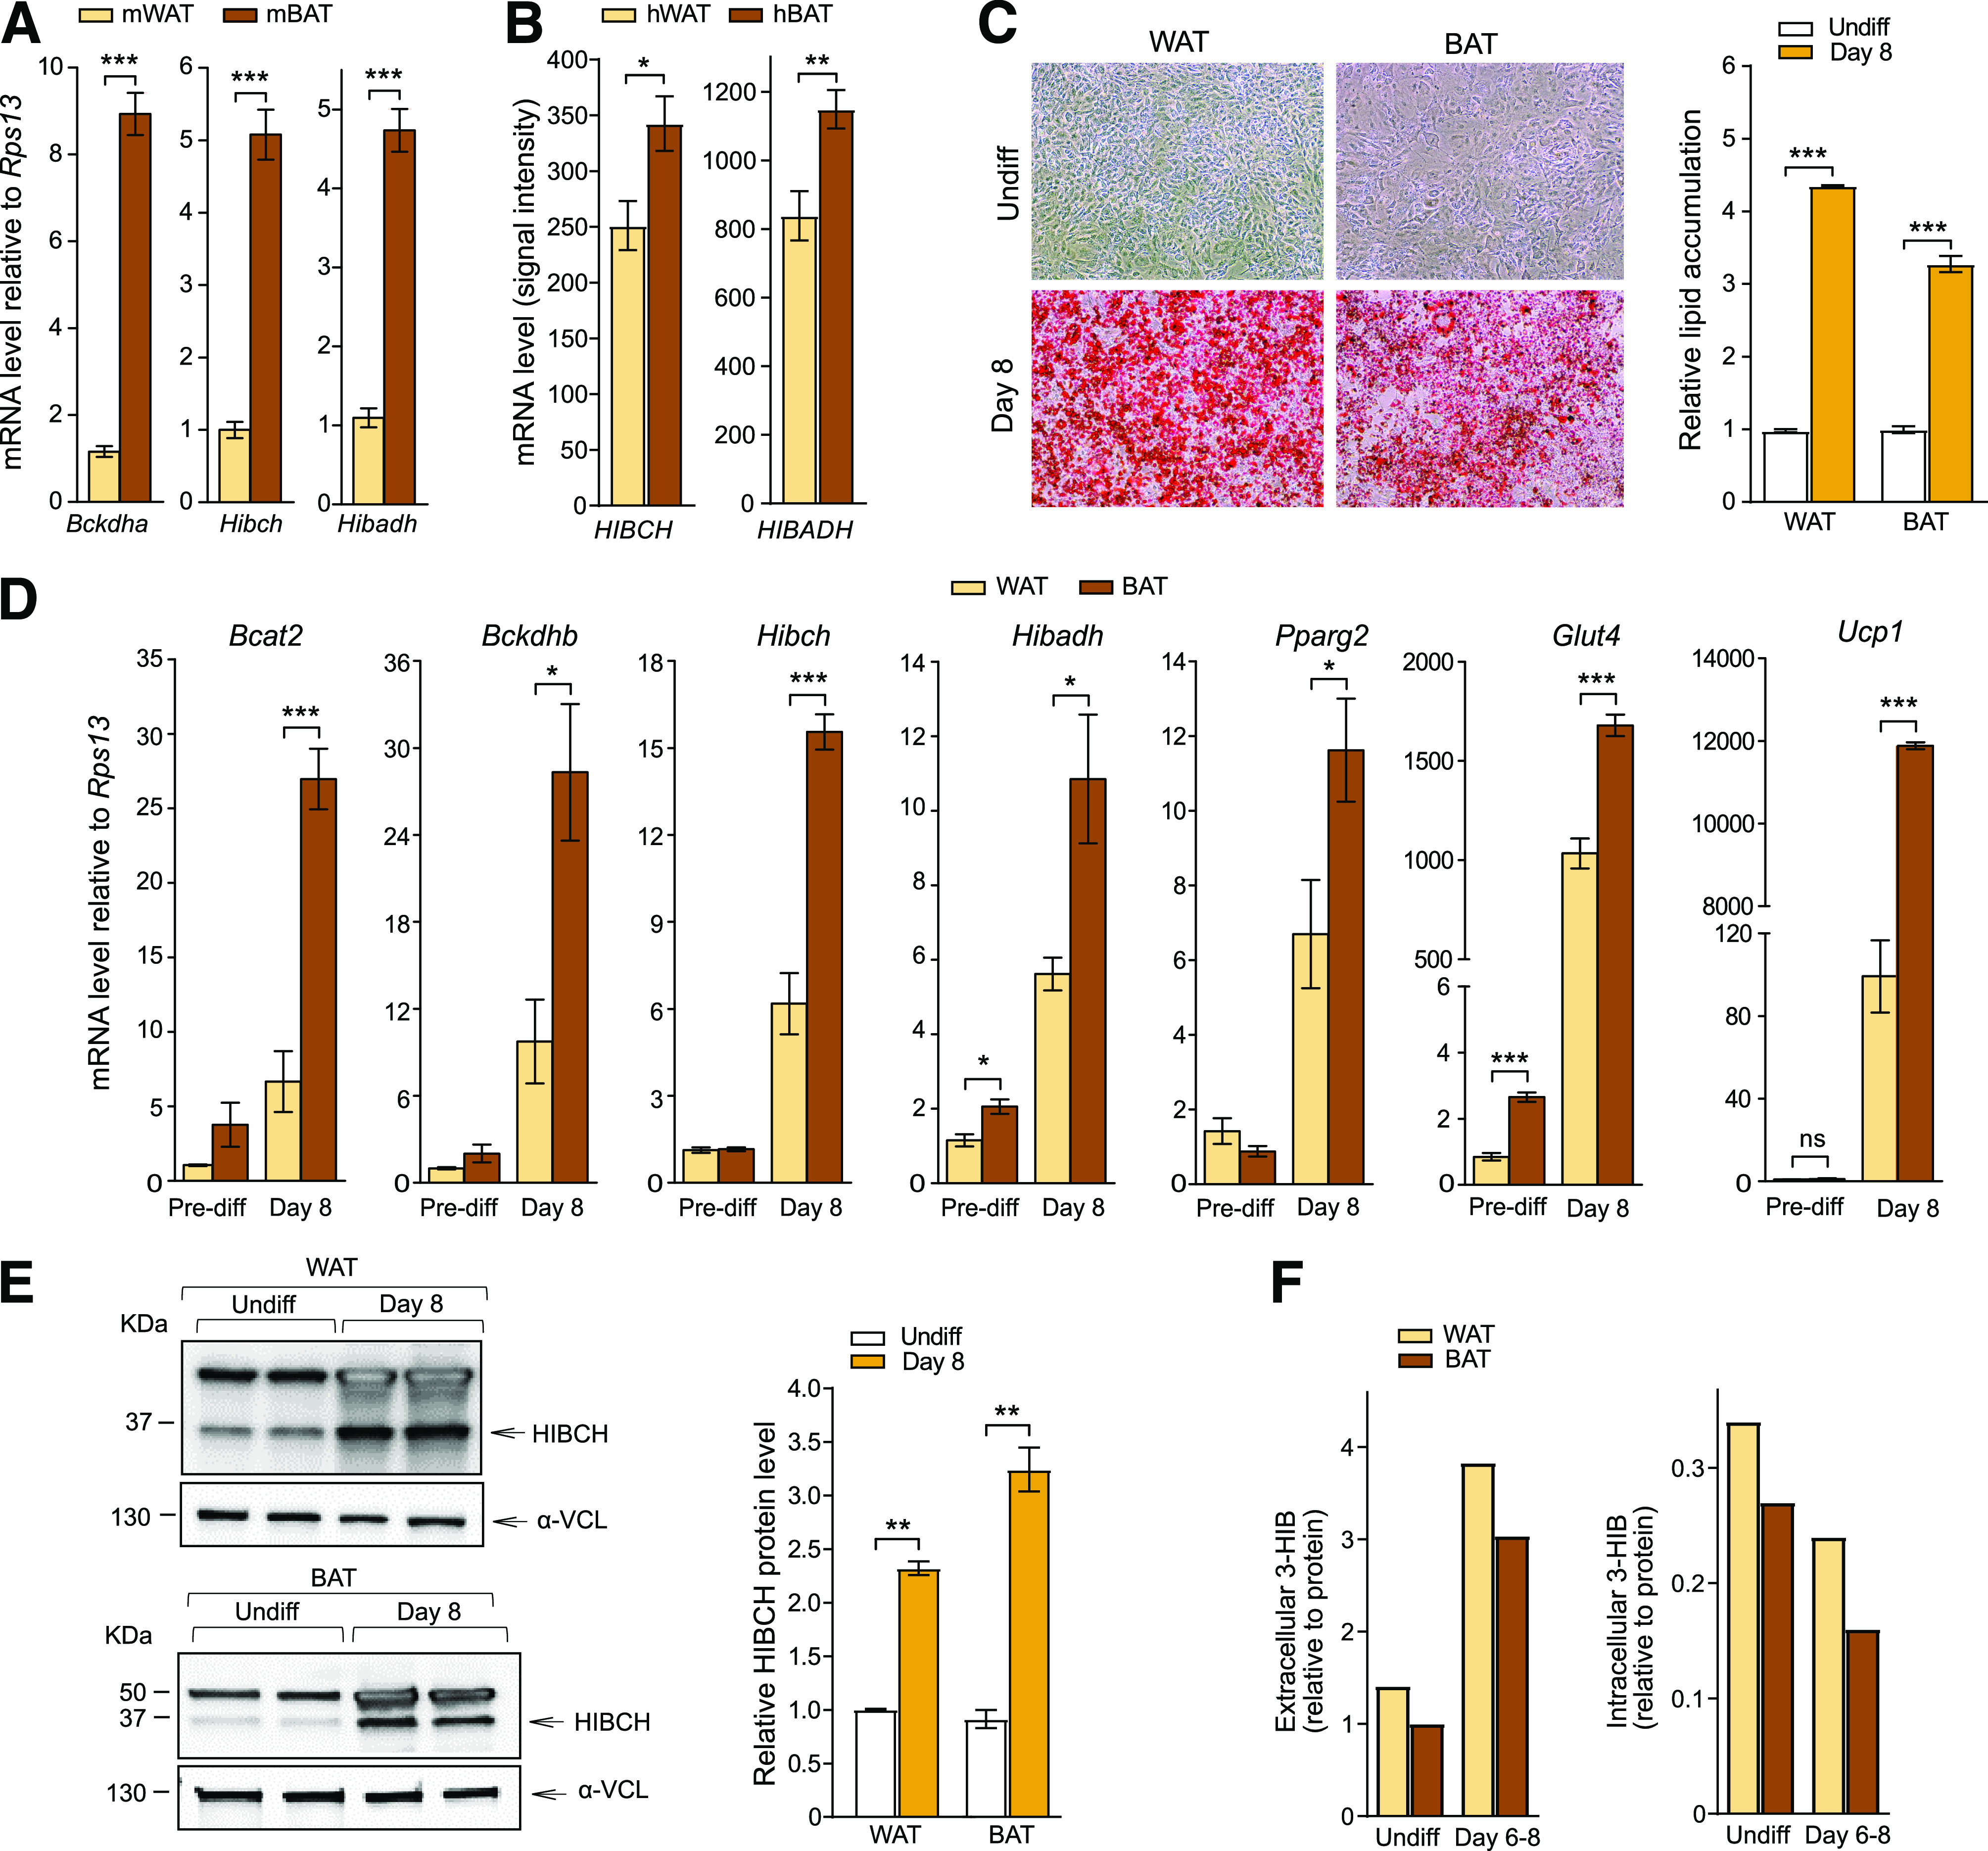
Comparison of white and brown adipocytes shows differences in BCAA metabolism. A: Relative mRNA levels of Bckdha, Hibch, and Hibadh in WAT and BAT dissected from C57BL/6 mice (mWAT and mBAT) (n = 10–12). B: Absolute values of mRNA levels (signal intensity) of HIBCH and HIBADH from array analysis of perirenal human adipocytes from WAT and BAT surgical biopsies (from healthy kidney donors) (hWAT and hBAT) (n = 10). C: Representative images of Oil Red O lipid stained adipocytes (left) and quantification of lipid accumulation (right) (n = 3) in immortalized WAT and BAT obtained from C57BL/6 mice. D: Relative mRNA levels of genes encoding BCAA catabolic enzymes and genes involved in differentiation, adipocyte maturation, and browning (n = 4). Expression was calculated relative to values in undifferentiated (Undiff) WAT cultures. The results are presented as mean ± SEM. E: Western blots showing protein levels of HIBCH (left) and the quantitative values of HIBCH relative to α-vinculin (α-VCL) (right). Relative values normalized to control (nontargeting siRNA) for each cell type are presented (n = 2). F: Extracellular (cell culture medium, 48-h consumption) and intracellular levels of 3-HIB (relative to protein) in undifferentiated controls and cells differentiated for 8 days (n = 1/time point; samples originating from six 15-cm dishes pooled together). *P < 0.05; **P < 0.01; ***P < 0.001. Pre-diff, predifferentiation.