
Figure 6.
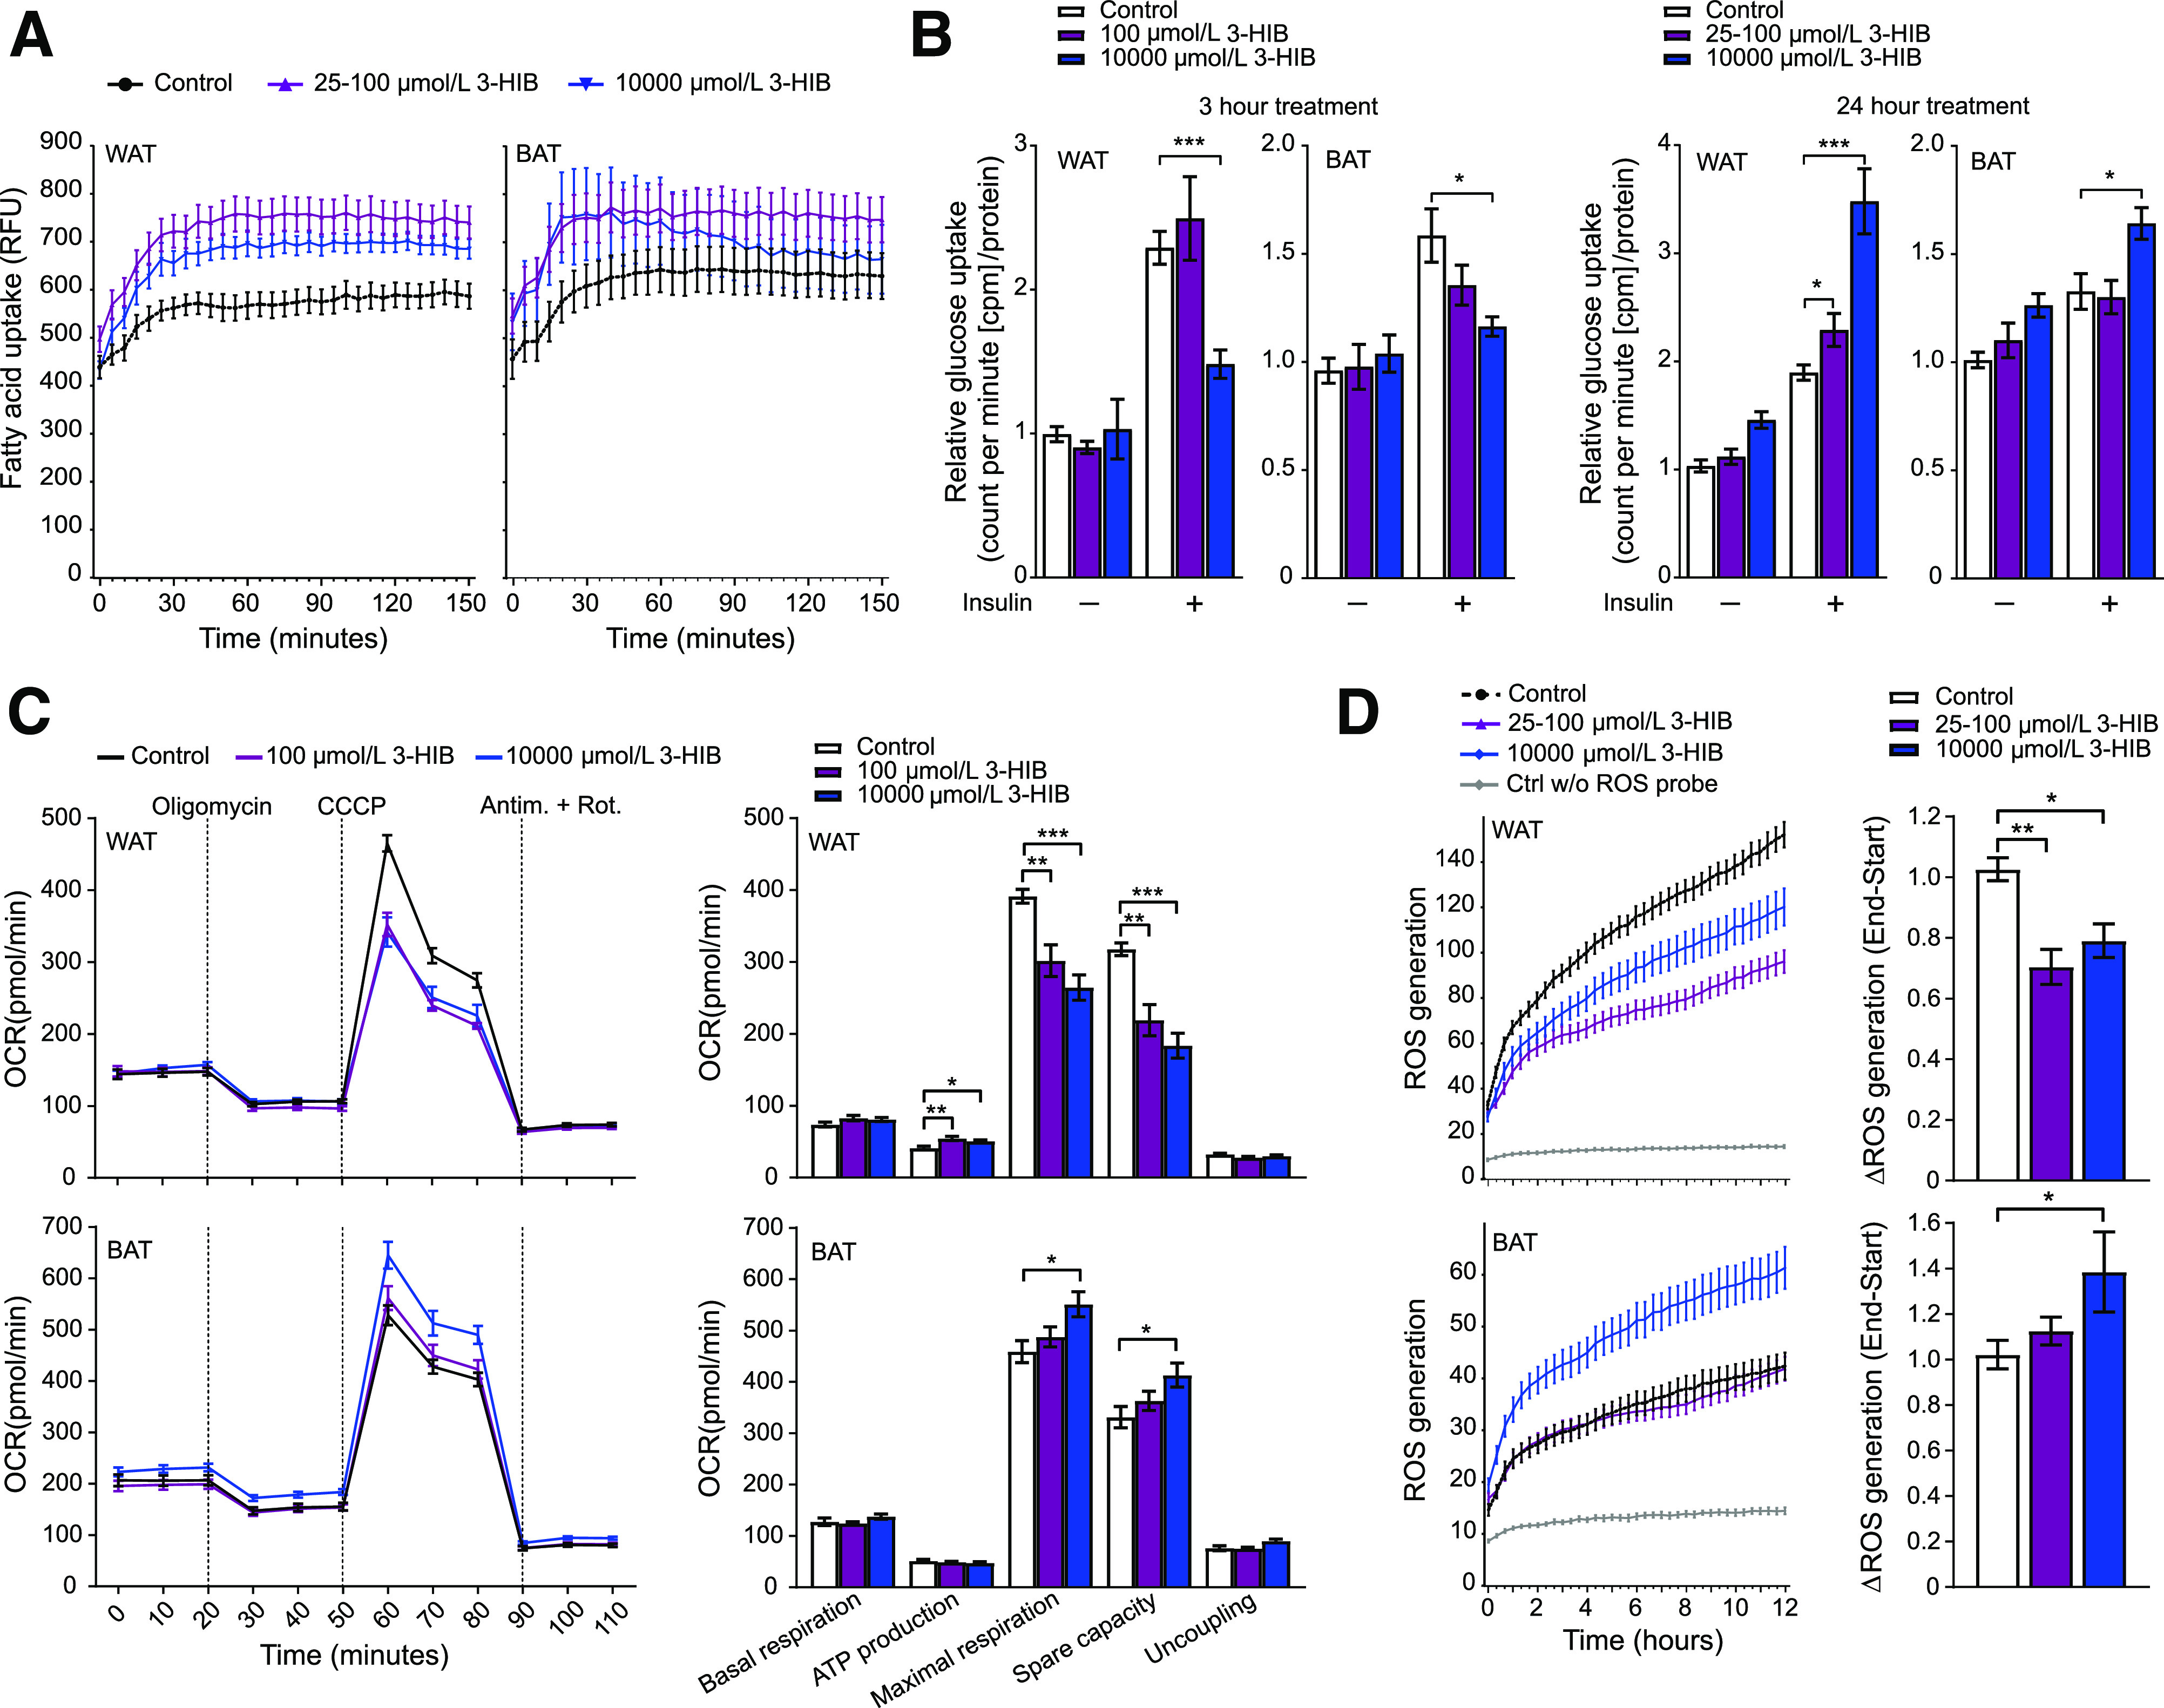
3-HIB affects uptake of fatty acids and glucose, mitochondrial respiration, and ROS generation in WAT and BAT adipocytes. A: Fatty acid uptake (shown by relative fluorescence units [RFU]) at day 6 in differentiating WAT and BAT cells (n = 11–12). 3-HIB (final concentrations of 25–100 μmol/L and 10 mmol/L) was added minutes (∼5 min) before starting the measurements. B: Glucose uptake (shown by counts per minute [cpm]/μg protein) at day 6 in differentiating WAT and BAT cells (n = 5–6) with (+) or without (−) insulin (ordinary one-way ANOVA). 3-HIB (final concentrations of 25–100 μmol/L and 10 mmol/L) was added to the cells 3 h or 24 h before measurements. Water was used as control to 3-HIB treatment. C: Seahorse XF Cell Mito Stress Assay was performed following the manufacturer’s Mito Stress protocol using the Seahorse XFe96 Analyzer to assess the mitochondrial respiration in WAT and BAT (n = 10–12) at day 5 in differentiation. 3-HIB treatment (final concentrations of 100 μmol/L and 10 mmol/L) was added 2 h before the first oxygen consumption rate (OCR) measurements in the Seahorse XFe96 Analyzer. Measurements of OCR were performed during injection of the mitochondrial-modulating compounds oligomycin, carbonyl cyanide m-chlorophenyl hydrazine (CCCP), antimycin A (Antim.), and rotenone (Rot.) (final 1 μmol/L of each, as indicated at the top in the top left panel). Outliers were removed based on a whisker Tukey test of the OCR data for each time point in each well. Basal respiration, ATP production, maximal respiration, spare capacity, and uncoupling were calculated for each well based on the OCR measurements, in accordance with the protocol from the manufacturer (Agilent Technologies). D: Short-term effect of 3-HIB addition on the production of ROS at day 6 in differentiating WAT and BAT cells (n = 11). 3-HIB (final concentrations of 25 μmol/L, 100 μmol/L, and 10 mmol/L) was added 5 min before starting the measurements. A, C, and D: Data were normalized to cell counts per well by Hoechst staining. *P < 0.05; **P < 0.01; ***P < 0.001. Ctrl w/o, control without.