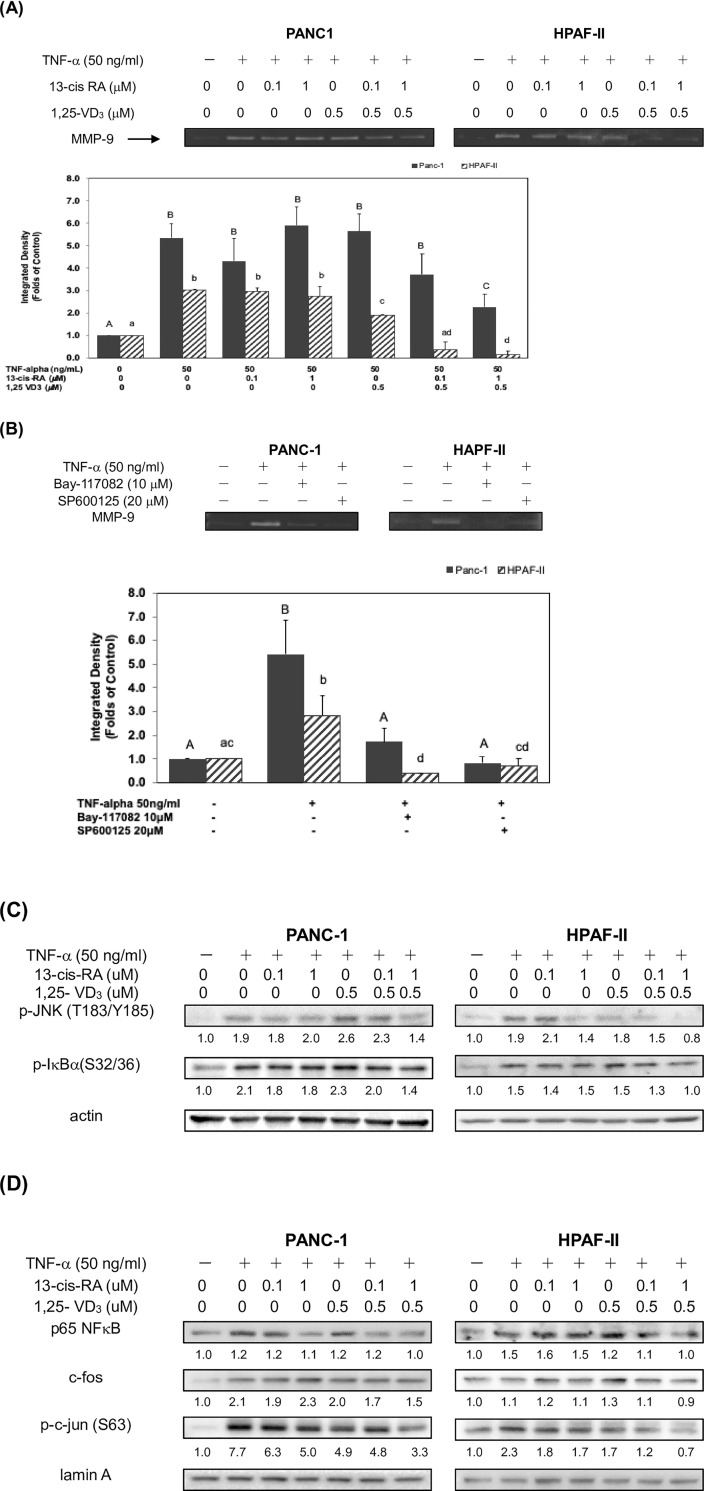
Fig 3. 13-cis RA and 1,25-VD3 inhibited TNF-α-mediated expression of MMP-9 protein through blockade of NF-κB and JNK signaling pathways.
Post-confluent human PDAC cells were cultured in 24-well plates and incubated in 10% FBS DMEM at 37°C. After washing out the media, cells were incubated in serum-free medium (Conditioned Medium; CM) in the presence or absence of TNF-α at 37°C for 24 hrs. (A) Human PDAC cells were also treated with either 13-cis RA or 1, 25-VD3 in different subgroups. CM was collected and loaded into gelatin-containing zymogram gel stained with Coomassie blue stains (see Materials and Methods). The levels of detection represent zymogram expression of MMP-9 in human PDAC cells. Different upper-case letters (A, B, C) represent statistically significant differences among subgroups in PANC-1 cells (P<0.05). Different lower-case letters (a, b, c, d) represent statistically significant differences among subgroups in HPAF-II cells (P<0.05). (B) Human PDAC cells were treated with or without TNF-α in the presence of Bay-117082 (a specific NF-κB inhibitor) or SP600125 (a specific JNK inhibitor). Different upper-case letters (A, B) represent statistically significant differences among subgroups in PANC-1 cells (P<0.05). Different lower-case letters (a, b, c, d) represent statistically significant differences among subgroups in HPAF-II cells (P<0.05). (C) Western blot analysis of cytoplasmic proteins (at 24 hr time point) was performed using monoclonal antibodies against p-JNK (T183/Y185), p-IκB (S32/36) and internal control (actin). Band intensities represent the amounts of p-JNK (T183/ Y185) and p-IκB (S32/36) in cytoplasma (D) Western blot analysis of nuclear proteins (at 24 hr time point) was performed using monoclonal antibodies against p65 NF-κB, c-fos, p-c-jun (S63) and internal control (lamin A). Band intensities represent the amounts of p65 NF-κB, c-fos, p-c-jun (S63) in the nuclei of human PDAC cells.

