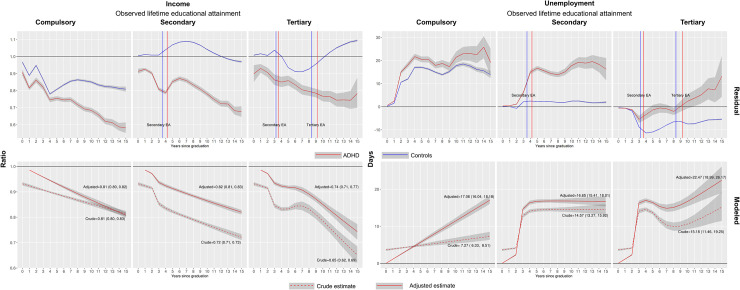
Fig 1. Influence of ADHD on occupational trajectories by highest observed educational attainment.
Residual panel: Influences from cohort (i.e., year of graduation from compulsory school) and index year of observation have been removed through regression before calculating means and confidence intervals. The observations are thus relative to the population trend in each outcome, indicated by the horizontal lines. Vertical lines in plots for secondary and tertiary educational attainment indicate the average year after compulsory school graduation for each educational level among individuals with (dotted) and without (solid) ADHD respectively. Modeled panel: Estimates of income and unemployment relative to controls (horizontal lines). The dashed line represent crude estimates (e.g., the income ratio of ADHD to controls) while the full line represent estimates from the adjusted model. For details on the model, see main text. Texts inside plots are the estimated income ratios and unemployment days at end of follow-up (i.e., year 15). The models for the adjusted income ratios include a lag, thus these curves drop the first observation and begin at year one of follow-up.

