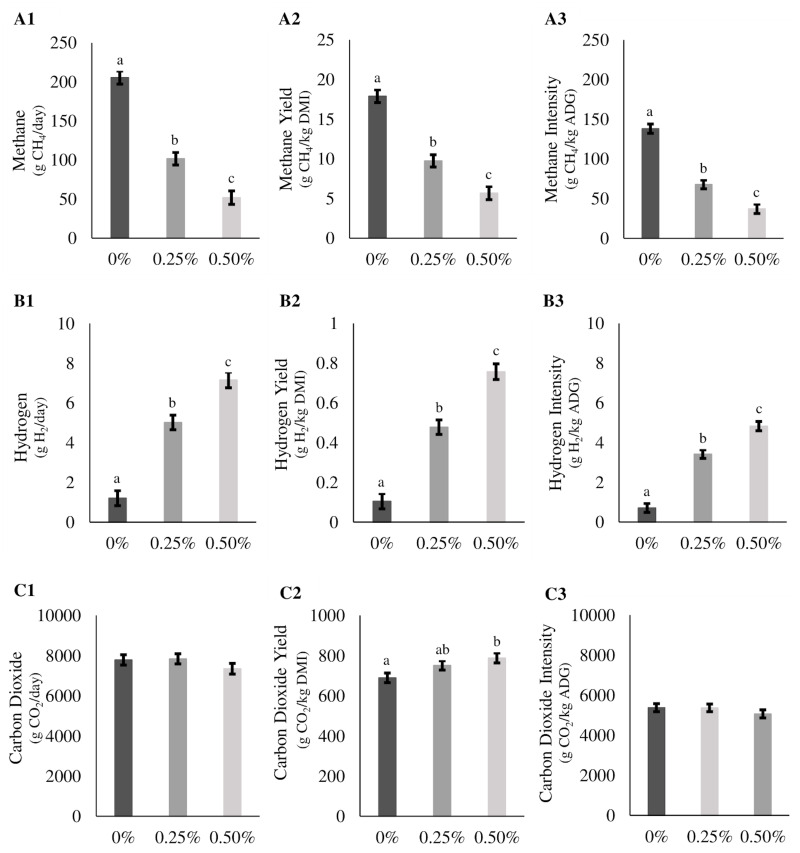
Fig 2. Asparagopsis taxiformis inclusion effects on methane, hydrogen and carbon dioxide emissions over a 147-day period.
Means, standard deviations, and statistical differences of methane, hydrogen, and carbon dioxide production (g/d) (A1,B1,C1), yield (g/kg dry matter intake (DMI)) (A2,B2,C2), and intensity (g/kg average daily gain) (A3,B3,C3) for 0%, 0.25% (Low), and 0.50% (High) Asparagopsis taxiformis inclusion. Means within a graph with different alphabets differ (P < 0.05).

