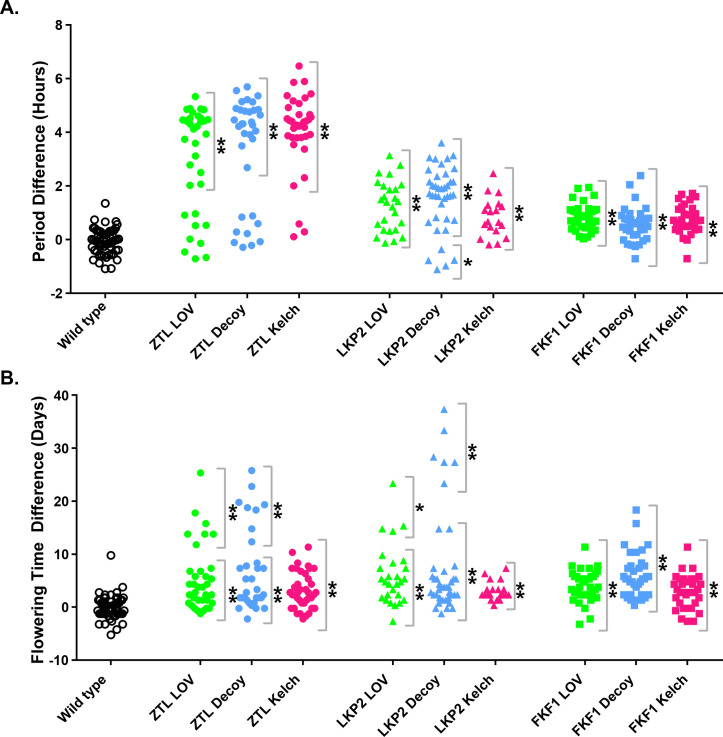
Fig 1. Phenotypes of plants expressing domains of ZTL, LKP2, and FKF1.
A) Period lengths and B) flowering time were measured for individual T1 insertion transgenics in the CCA1p::Luciferase background. A) Values presented are the difference between the period of the individual transgenic and the average period of the CCA1p::Luciferase control plants in the accompanying experiment. B) Values presented are the difference between the flowering time (as measured by the age at 1 cm inflorescence height) of the individual transgenics and the average flowering time of the CCA1p::Luciferase control plants in the accompanying experiment. * represents p < a Bonferroni corrected α of 3.8x10⁻³ (equivalent to p < 0.05); ** represents p < a Bonferroni corrected α of 7.7x10⁻⁴ (equivalent to p < 0.01).

