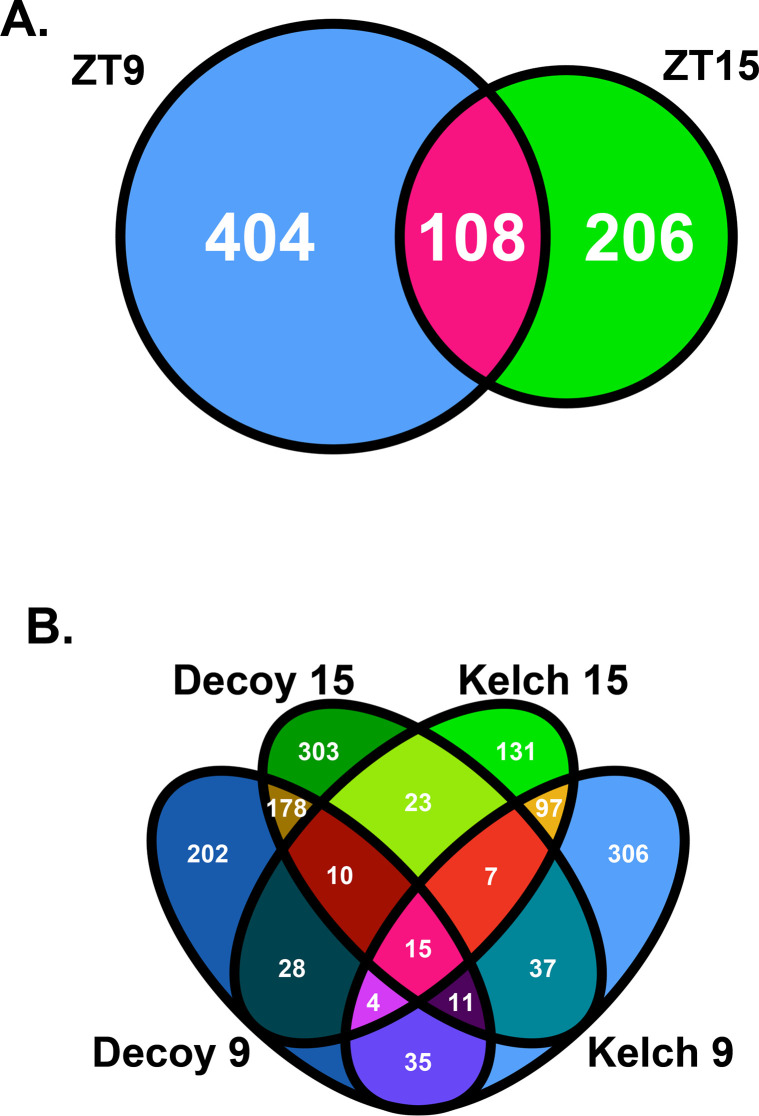
Fig 3. Comparison of ZTL Kelch repeat domain interaction profiles.
A) A Venn diagram of the interaction profiles of the ZTL Kelch repeat domain at ZT9 and ZT15. B) A Venn diagram of the interaction profiles of the ZTL Kelch repeat domain at ZT9 and ZT15 with the ZTL decoy from [13] at ZT9 and ZT15.

